GRC Open-Source Tools: Falco, Wazuh & Probo (CrowdStrike/Vanta Alternative, Zero SaaS Bills)
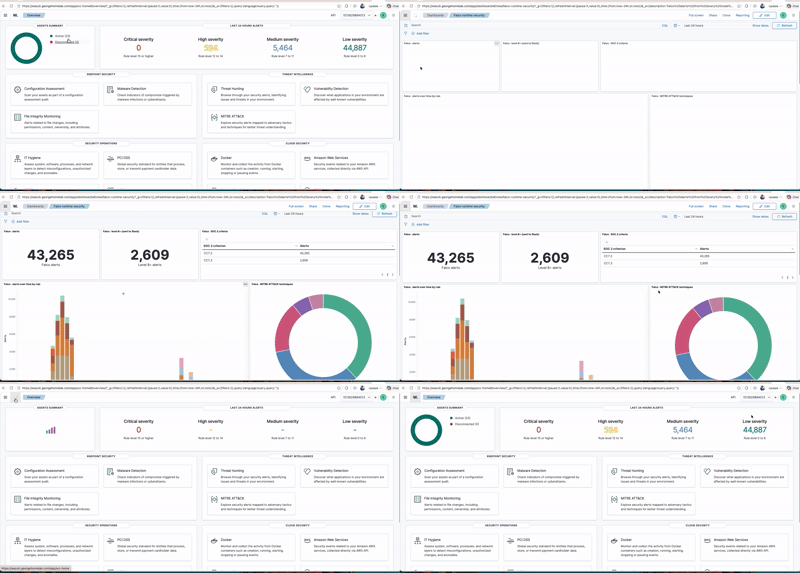
Part of the homelab build series. Governance, risk and compliance on open source only: Kyverno blocks, Falco detects live threats, Wazuh correlates and maps them to MITRE ATT&CK and SOC 2, and Probo holds the evidence. A brownfield build on an RKE2 cluster that already runs Istio, Keycloak, Ceph, Argo CD, Kyverno, KubeArmor and Trivy. Highly available: three Wazuh indexers, one per Proxmox host, and three Wazuh managers.
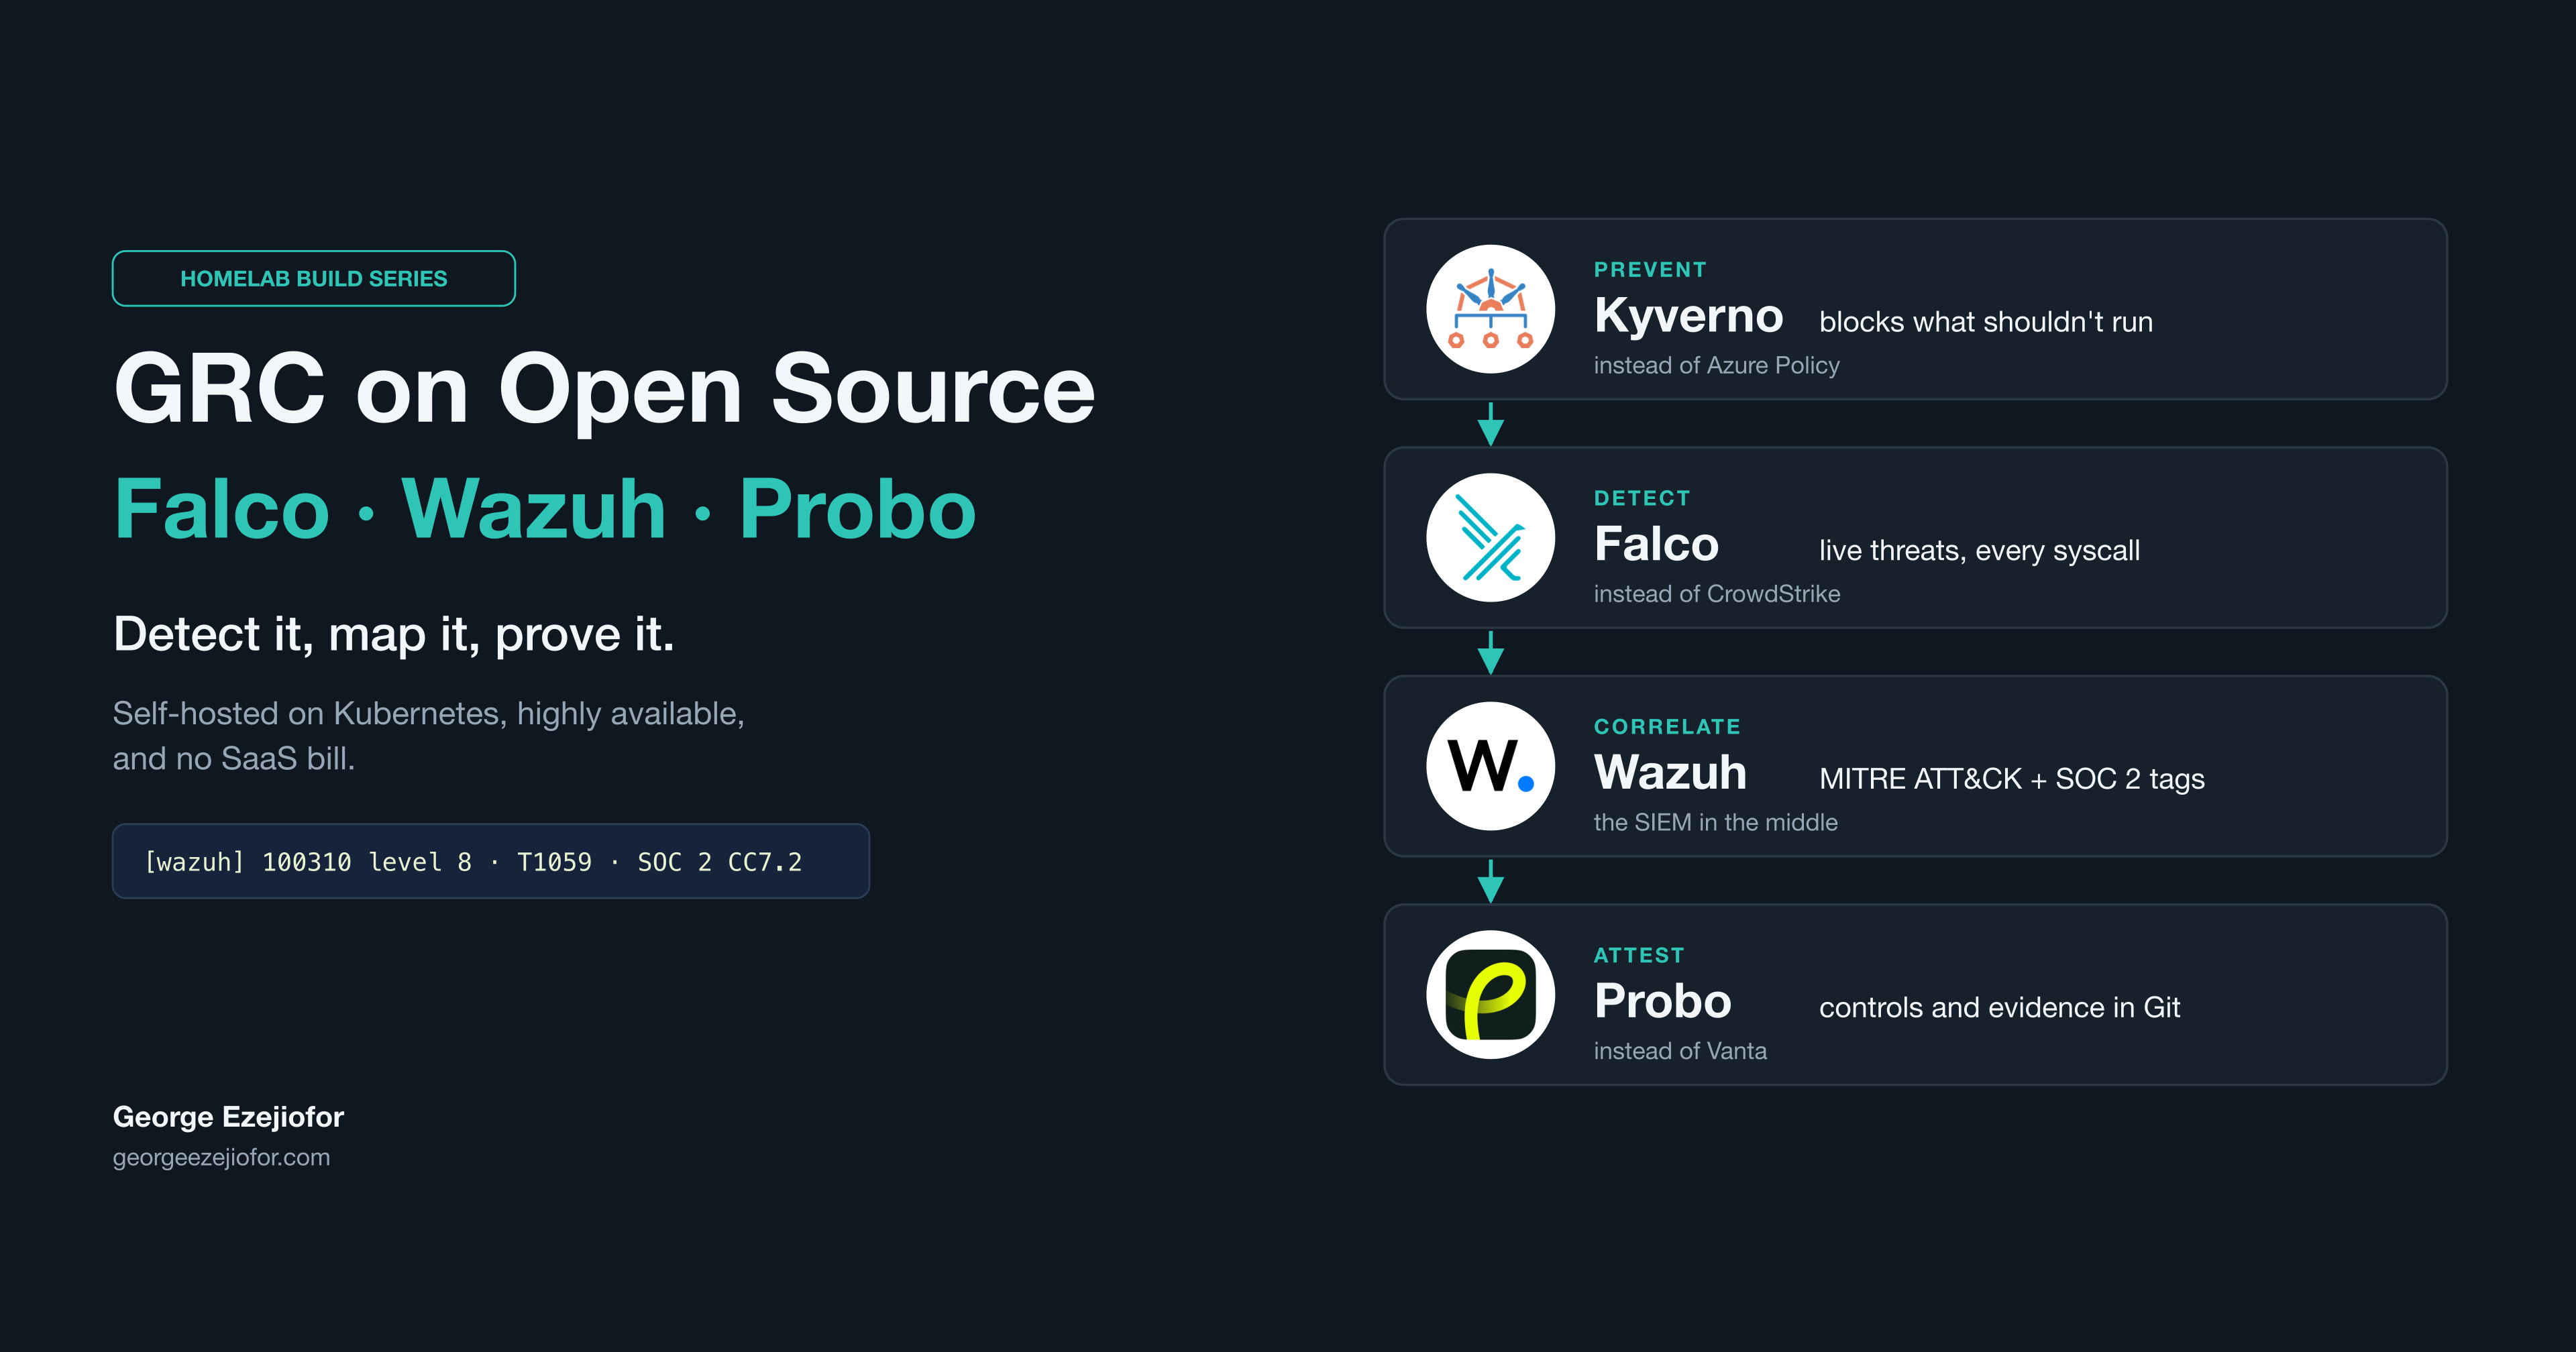
Open-source GRC: Kyverno, Falco, Wazuh and Probo
Introduction
My cluster had 41 Kyverno policies, KubeArmor enforcing AppArmor profiles and Trivy scanning every image. If someone had opened a shell inside one of my containers, none of it would have told me.
That gap is what companies pay CrowdStrike to close. They pay Vanta to turn it into audit evidence, and Azure Policy to govern the whole thing, as long as it lives in Azure. All three are good products, and all three keep your data on their platform and bill you every year to keep it there.
I wanted the same capability on hardware I already own, with every rule and mapping in Git. So I added three open-source tools to the platform. Falco watches every system call on the nodes. Wazuh collects those alerts next to the host logs and tags each one with a MITRE technique and a SOC 2 criterion. Probo tracks the SOC 2 controls and which part of the platform answers each of them. Kyverno, already running, stays the gate at admission.
It works. A shell opened in a container now reaches the SIEM in under a second, posts to Slack and maps to SOC 2 control CC7.2. Getting there took more tuning than building. The first hour produced about 18,500 alerts, and I had to bring that down to 176 without hiding a single real attack.
To be clear about what this is: it replaces the tools, not the people behind a managed service. I'll come back to what that costs you near the end.
What you are locked into
With CrowdStrike Falcon you pay per device, billed annually and up front, so every node you add raises the bill. Your telemetry lives in their cloud. You can write your own detections, but you can't read theirs, and the threat intelligence stops the day you cancel.
Vanta doesn't publish prices. Buyers say the quote grows with headcount and with every framework you add. Over time your control mappings, your evidence and your audit history all build up inside it, collected through its integrations, so leaving means rebuilding evidence collection somewhere else.
Azure Policy governs Azure. A cluster outside Azure can join through Azure Arc, which installs Azure Policy as an extension running Gatekeeper, but Azure's control plane stays in the loop and the policies are written in Azure's JSON format with Azure resource aliases. They don't come with you.
In this build every rule is Falco YAML, every mapping is Wazuh XML and every control is a line in a Git file. If I moved clusters tomorrow, all of it would come along.
Architecture
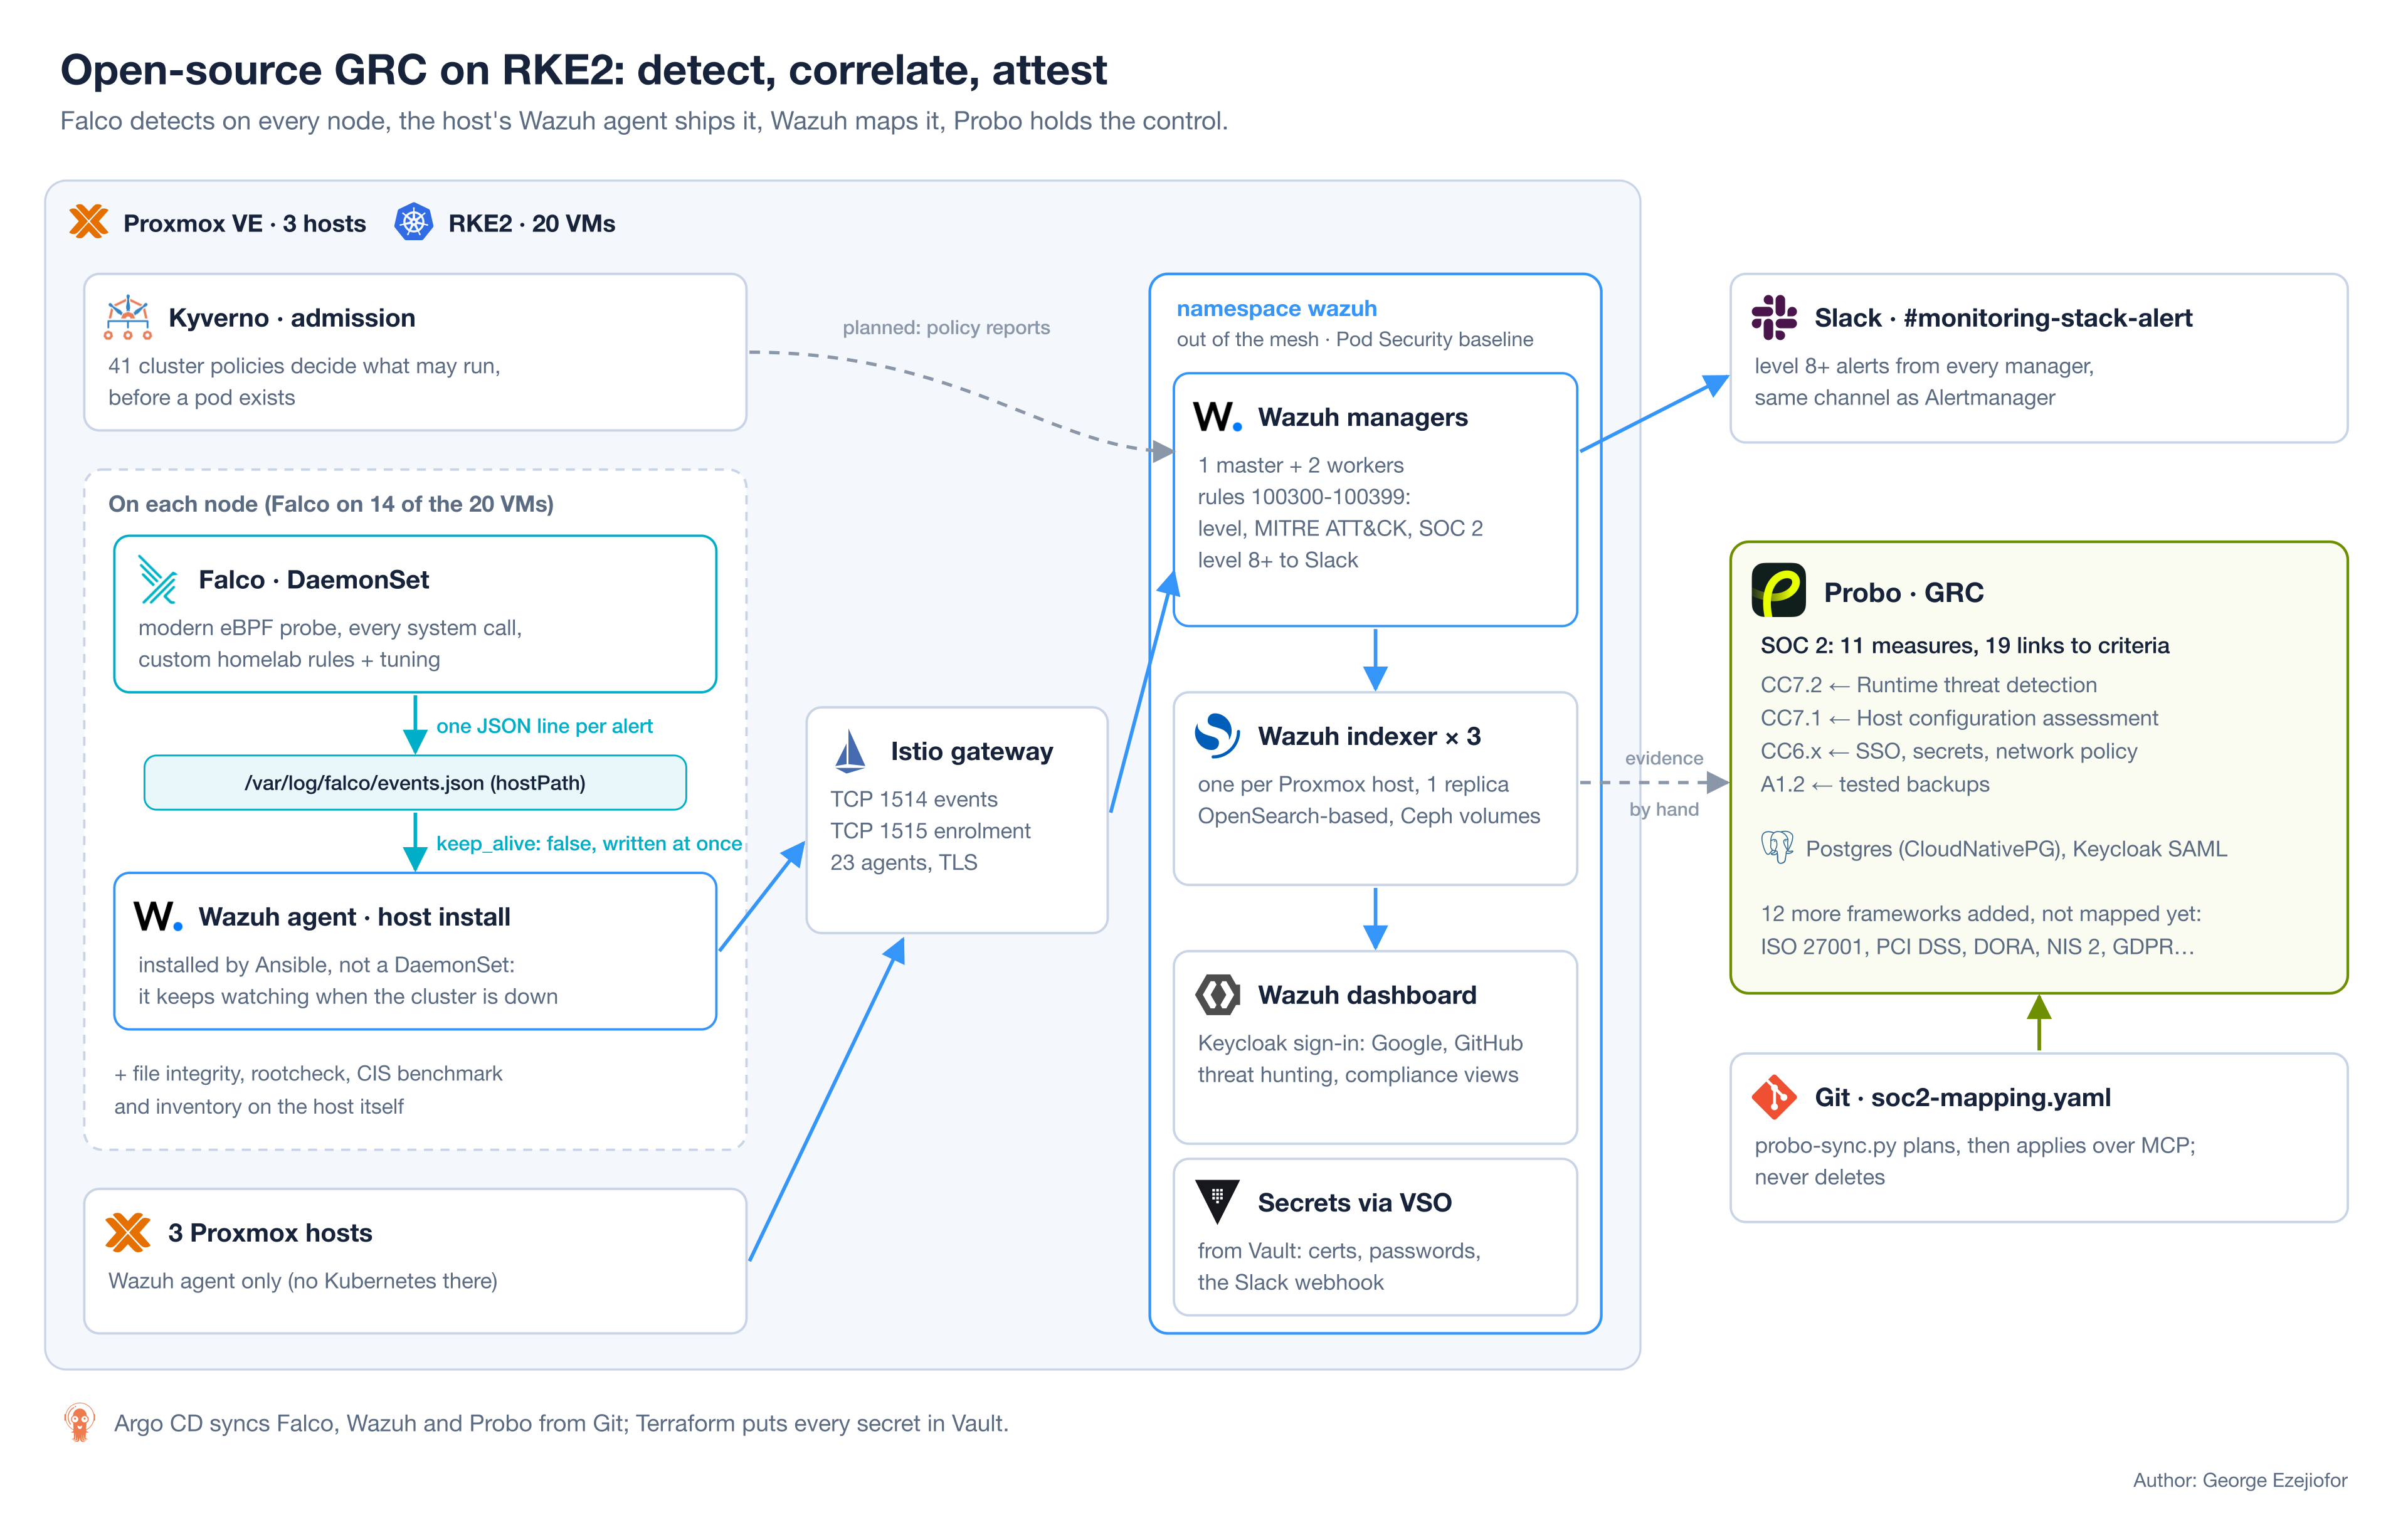
Architecture: Falco on each node, Wazuh agents on the hosts, the Istio gateway, the Wazuh cluster, Slack and Probo
I think of it as four layers, each answering one question:
| Layer | Tool | Question | Stands in for |
|---|---|---|---|
| Prevent | Kyverno | May this run at all? | Azure Policy |
| Detect | Falco | What is running right now, and is it an attack? | CrowdStrike |
| Correlate | Wazuh | What does it mean, and which technique and criterion does it hit? | the SIEM |
| Attest | Probo | Which control does it satisfy, and where's the evidence? | Vanta |
Kyverno came earlier in this series, so I don't rebuild it here. Its policy reports don't reach Wazuh yet, which is why that arrow is dashed.
Where the agents run
Wazuh documents two ways to run its agent in Kubernetes, as a DaemonSet or as a sidecar. I didn't use either. Ansible installs the agent on the host itself, on all 20 RKE2 VMs and the 3 Proxmox hosts.
The reasoning is simple: whatever watches the cluster shouldn't fall over when the cluster does. A DaemonSet agent only sees its own container unless you give it the host filesystem, privileged mode and the host PID namespace, at which point your security agent is the most privileged pod on every node. If the cluster goes down, a DaemonSet agent goes with it, and a dead node just looks like silence. The documented DaemonSet also mounts the Docker socket, and RKE2 runs containerd. And the Proxmox hosts aren't Kubernetes nodes at all, so only a host install reaches them.
So Falco covers the containers, and the host agent covers the host and carries Falco's alerts out.
Deploying Wazuh into a brownfield cluster
I vendored Wazuh's Kubernetes manifests at v4.14.9 without touching them, and change them only through patches in a Kustomize overlay that Argo CD applies. Upstream assumes a cloud and an empty cluster. Mine is neither, and several things broke.
The first surprise was four type: LoadBalancer Services. With MetalLB in the cluster, the dashboard, the manager API, the workers and the indexer API on 9200 would each have taken an address on my LAN. All four became ClusterIP, and only the Istio gateway is exposed. The manifests also ship default credentials, admin:SecretPassword and an enrolment password of password, plus four demo users with known hashes. Terraform generates every certificate, password and hash into Vault instead, and the Vault Secrets Operator syncs them into Secrets with the names upstream expects. Upstream's secret files never make it into the overlay.
Then the service mesh broke Wazuh's own clustering. With Istio sidecars, every connection reached the master from 127.0.0.6, so the two workers looked like one, only two of the three indexers joined, and Filebeat failed TLS. Wazuh already encrypts every hop, so I took the namespace out of the mesh. Upstream also sets vm.max_map_count from a privileged init container. Ansible sets it on the database nodes now, the init container is gone, and the namespace enforces Pod Security baseline. Restricted isn't possible, because the manager runs as root.
The one that cost me most was disk. Each manager downloads a 9.2 GB vulnerability feed, and upstream gives it 500Mi. I'd raised that to 10Gi, and within 15 minutes all three volumes were full, wazuh-db couldn't open its database, and the master stopped taking events. They have 40Gi each on Ceph now, on ceph-block instead of upstream's cloud StorageClass.
Agents reach the managers through the same Istio ingress gateway as everything else, with ports 1514 (events) and 1515 (enrolment) added as TCP routes. On the first enrolment, agents registered with the master and then connected to a worker that didn't have their key yet. They got "Invalid ID", tried again, were refused as duplicates, and settled after a few minutes.
At the end of it I had 23 agents active, 3 indexers green, a master and 2 workers.
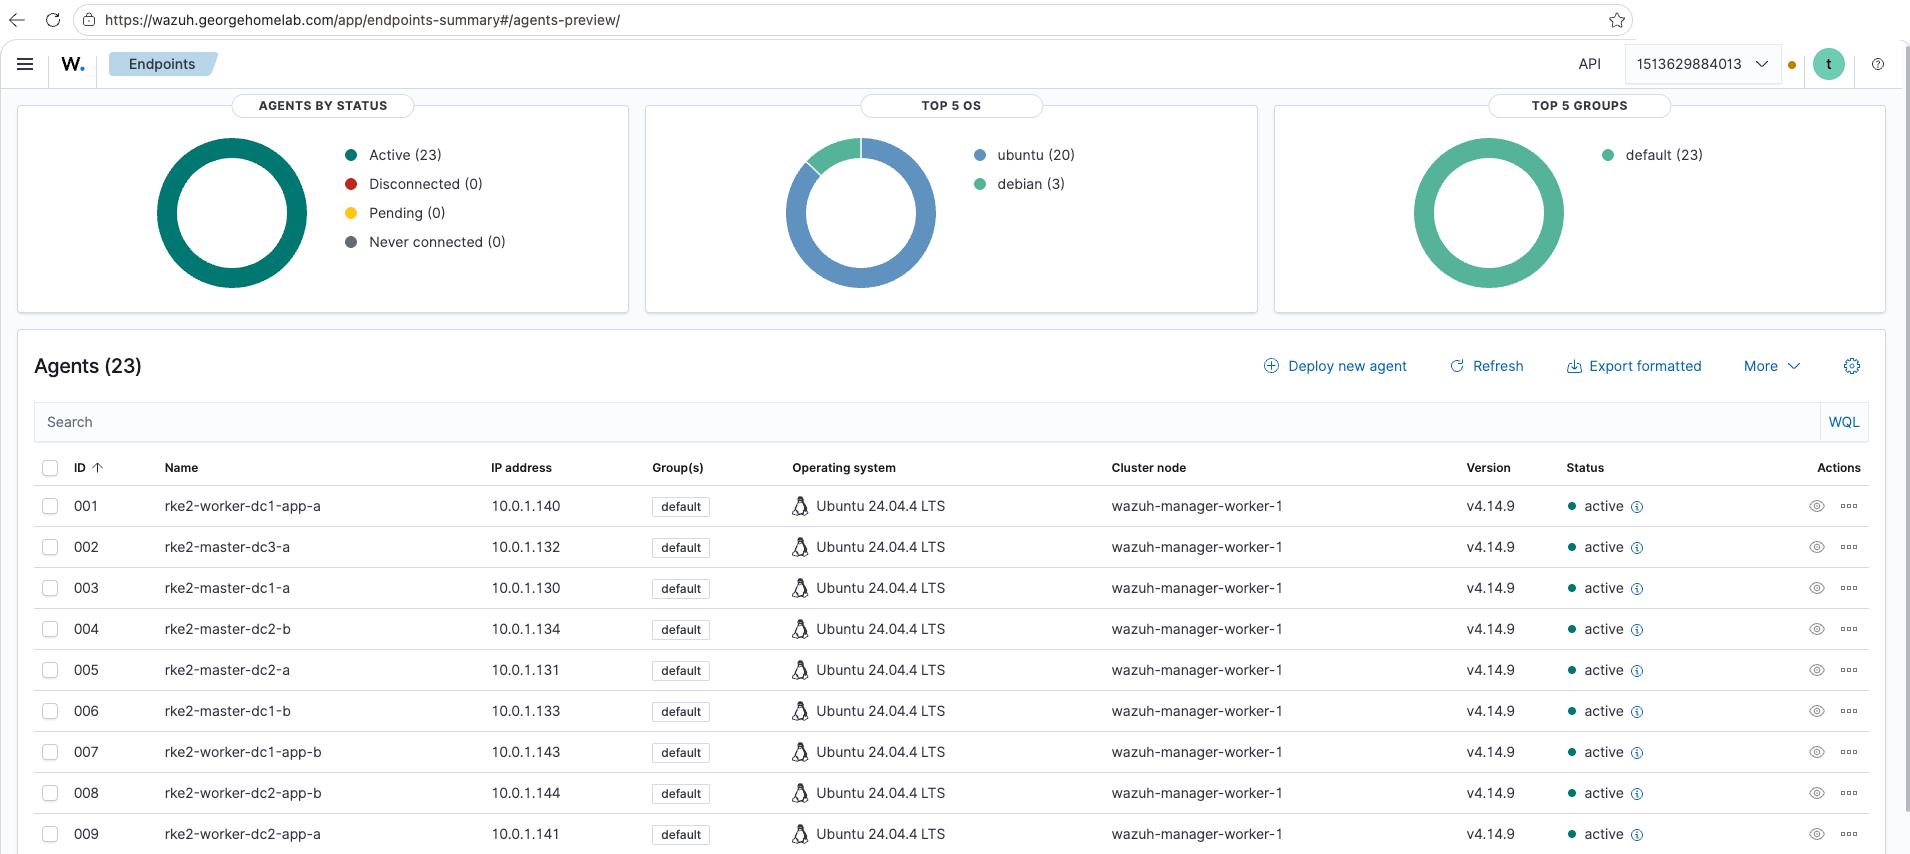
Wazuh Endpoints: 23 agents active, 20 Ubuntu RKE2 VMs and 3 Debian Proxmox hosts, all on Wazuh v4.14.9
Single sign-on with Keycloak
The dashboard signs in through Keycloak, like every other app on the platform. Terraform creates a wazuh realm with Google and GitHub sign-in and an email allow-list, so any other account is turned away at first login. The indexer maps the allowed emails to all_access, and the internal admin from Vault stays as a break-glass login.
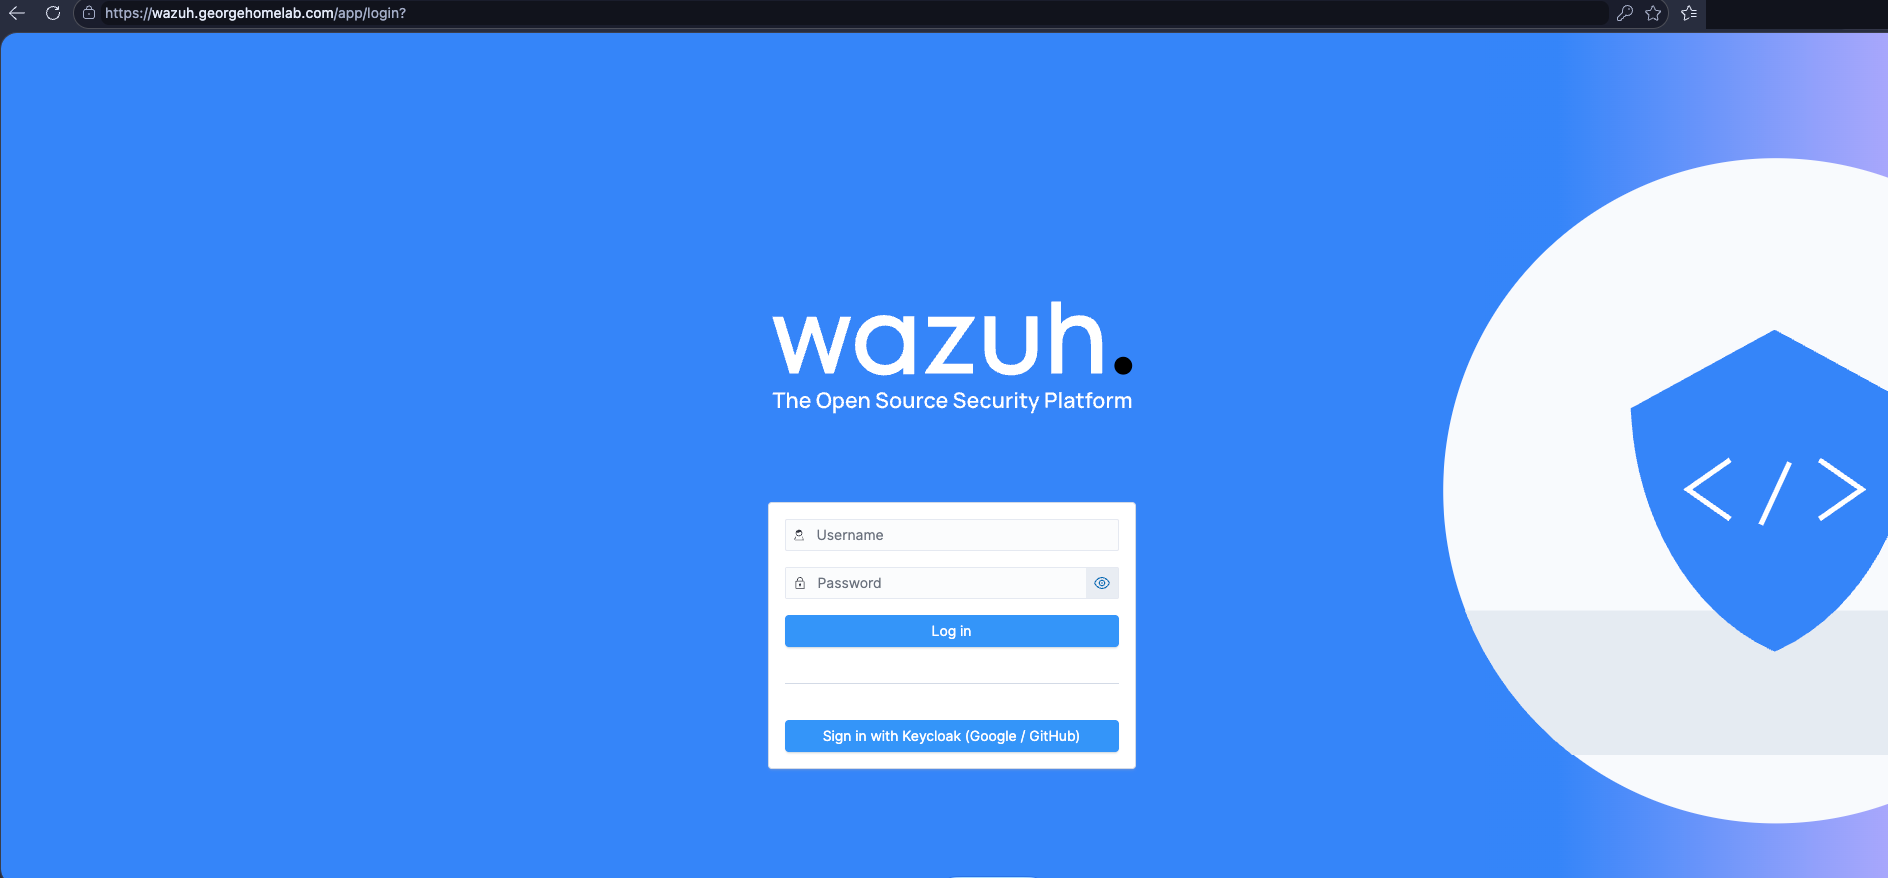
The Wazuh login page: the internal login stays as a break-glass, and "Sign in with Keycloak" is how people get in
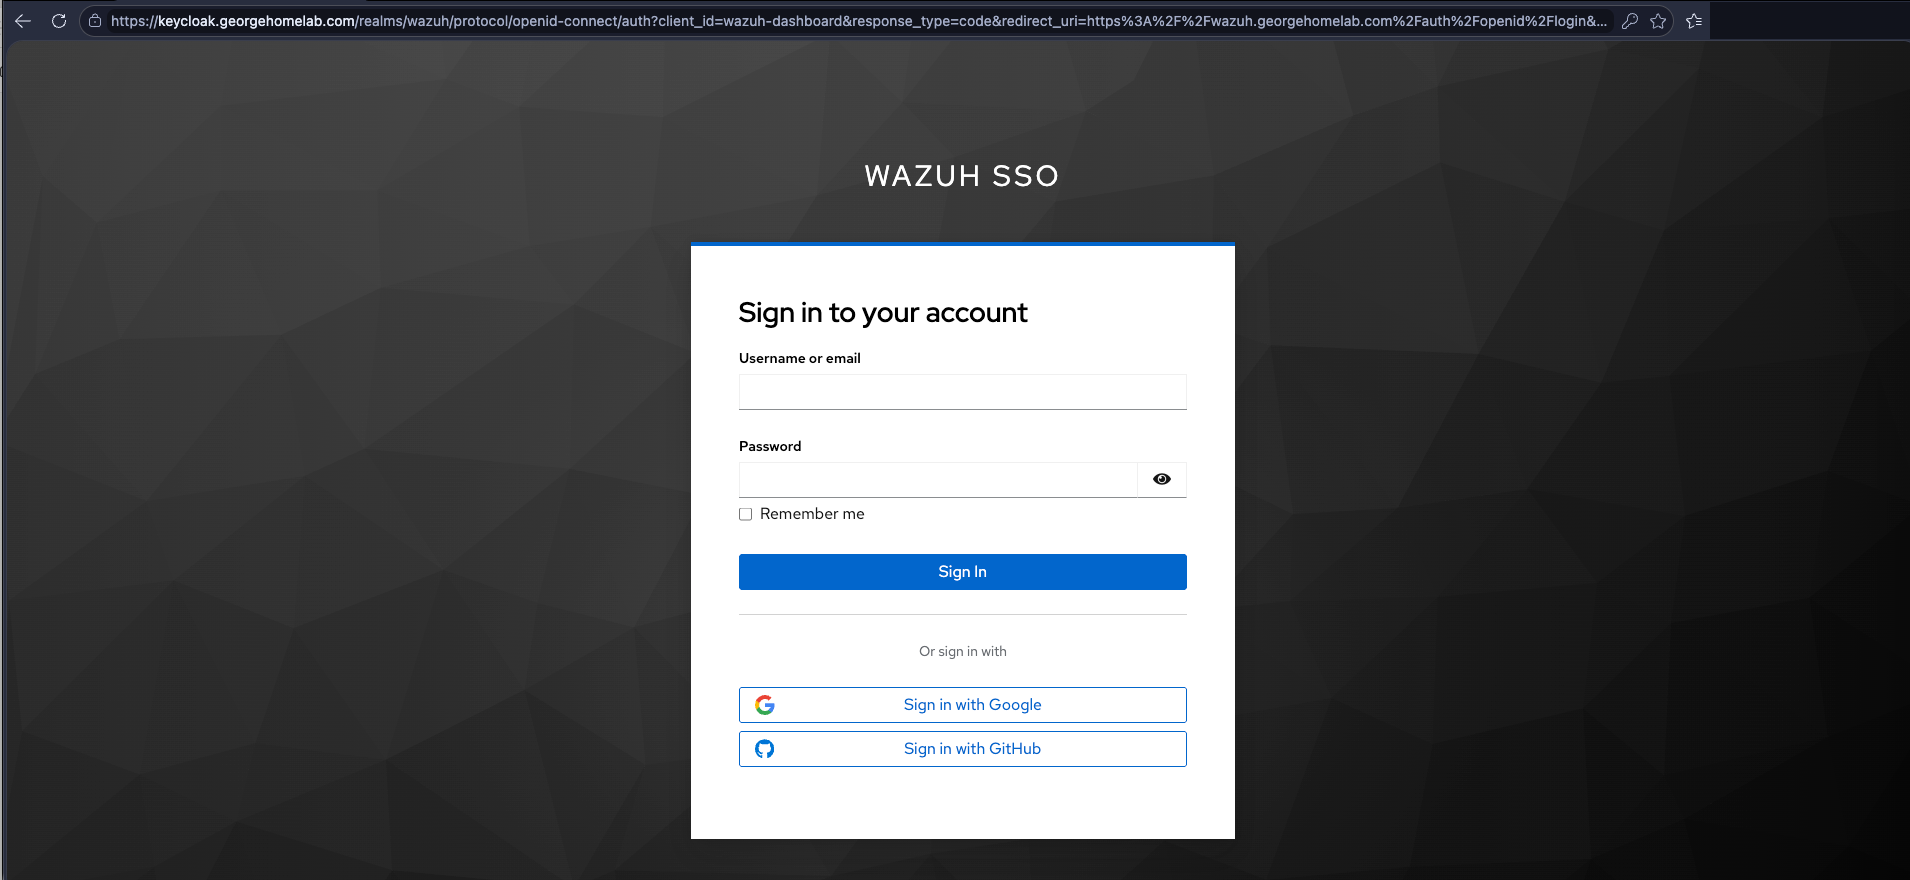
Keycloak realm wazuh: sign in with Google or GitHub; only allow-listed emails get through
Bringing Falco back
Falco had been switched off on this cluster for a while. It was using 875 to 956 millicores per node against a 100m request, and I needed the CPU.
When I turned it back on, every pod crash-looped. Falco itself started fine, but its container plugin (0.6.3, bundled with chart 8.0.2) panicked on a nil pointer: containerd 2.3 leaves a field empty that the plugin reads without checking. Pinning the plugin to 0.7.4 fixed it without a chart upgrade.
collectors:
  containerEngine:
    pluginRef: ghcr.io/falcosecurity/plugins/plugin/container:0.7.4
A changed ConfigMap doesn't restart a DaemonSet, so I had to restart the pods before they picked it up.
Routing Falco alerts to Wazuh
My first idea was Falcosidekick posting straight to Wazuh. That doesn't work, because the manager listens for syslog, not HTTP, and every alert would arrive with no idea which host it came from.
What I did instead needs no new component. Falco writes each alert as one JSON line to a file on the node, and the Wazuh agent that's already on that host reads it. Every alert reaches Wazuh tagged with the right host, through the same gateway and TLS as everything else.
falco:
  file_output:
    enabled: true
    keep_alive: false
    filename: /var/log/falco/events.json

mounts:
  volumes:
    - name: falco-events
      hostPath:
        path: /var/log/falco
        type: DirectoryOrCreate
  volumeMounts:
    - name: falco-events
      mountPath: /var/log/falco
I didn't edit 23 hosts to point the agents at that file. Wazuh's shared configuration does it from the master:
<agent_config>
  <localfile>
    <log_format>json</log_format>
    <location>/var/log/falco/events.json</location>
  </localfile>
</agent_config>
A small set of rules, IDs 100300 to 100399, turns Falco's priorities into Wazuh levels and tags each alert with a MITRE technique and a SOC 2 criterion:
<rule id="100311" level="8">
  <if_sid>100302</if_sid>
  <field name="rule">^Read sensitive file untrusted$|^Read Sensitive File in Container$</field>
  <description>Falco: sensitive file read in $(output_fields.k8s.ns.name)/$(output_fields.k8s.pod.name)</description>
  <mitre>
    <id>T1003.008</id>
  </mitre>
  <group>tsc_CC7.2,tsc_CC7.3,</group>
</rule>
That keep_alive: false in the Falco config looks like a detail. It isn't, and the tuning section explains why. Two other things caught me out here. The master syncs new rules to the workers, but the workers keep using the old ones until analysisd reloads (PUT /cluster/analysisd/reload), so for a while half the cluster looked silent. And the file needs rotating, which logrotate does with copytruncate, rolled out by Ansible. The agent notices the truncation and reads from the top again.
Alerts in Slack
Anything at level 8 or above goes to Slack, into the channel Alertmanager already posts to. Wazuh has a built-in Slack integration, so the message carries the mapped alert: host, pod, MITRE technique and SOC 2 criterion.
The webhook is a secret, and ossec.conf can't read secrets from a file. So the Vault Secrets Operator renders the whole integration block, and an init container appends it to the manager's config when the pod starts:
transformation:
  excludeRaw: true
  templates:
    slack.conf:
      text: |-
        <ossec_config>
          <integration>
            <name>slack</name>
            <hook_url>{{ get .Secrets "hook_url" | trim }}</hook_url>
            <level>8</level>
            <alert_format>json</alert_format>
          </integration>
        </ossec_config>
Terraform fills that Vault value from the same variable as Alertmanager's webhook, so rotating one rotates both. While setting this up I also worked out why I'd once missed an Alertmanager alert. A Slack incoming webhook posts to the channel it was created for and ignores the channel in your config. My alerts had been arriving all along, just not in the channel the config named, and the one I needed was buried among routine warnings.
Something to know before you copy this: Wazuh writes the full webhook URL to /var/ossec/logs/integrations.log every time it sends. Don't screenshot that file, and assume anyone who can exec into the managers has the URL.
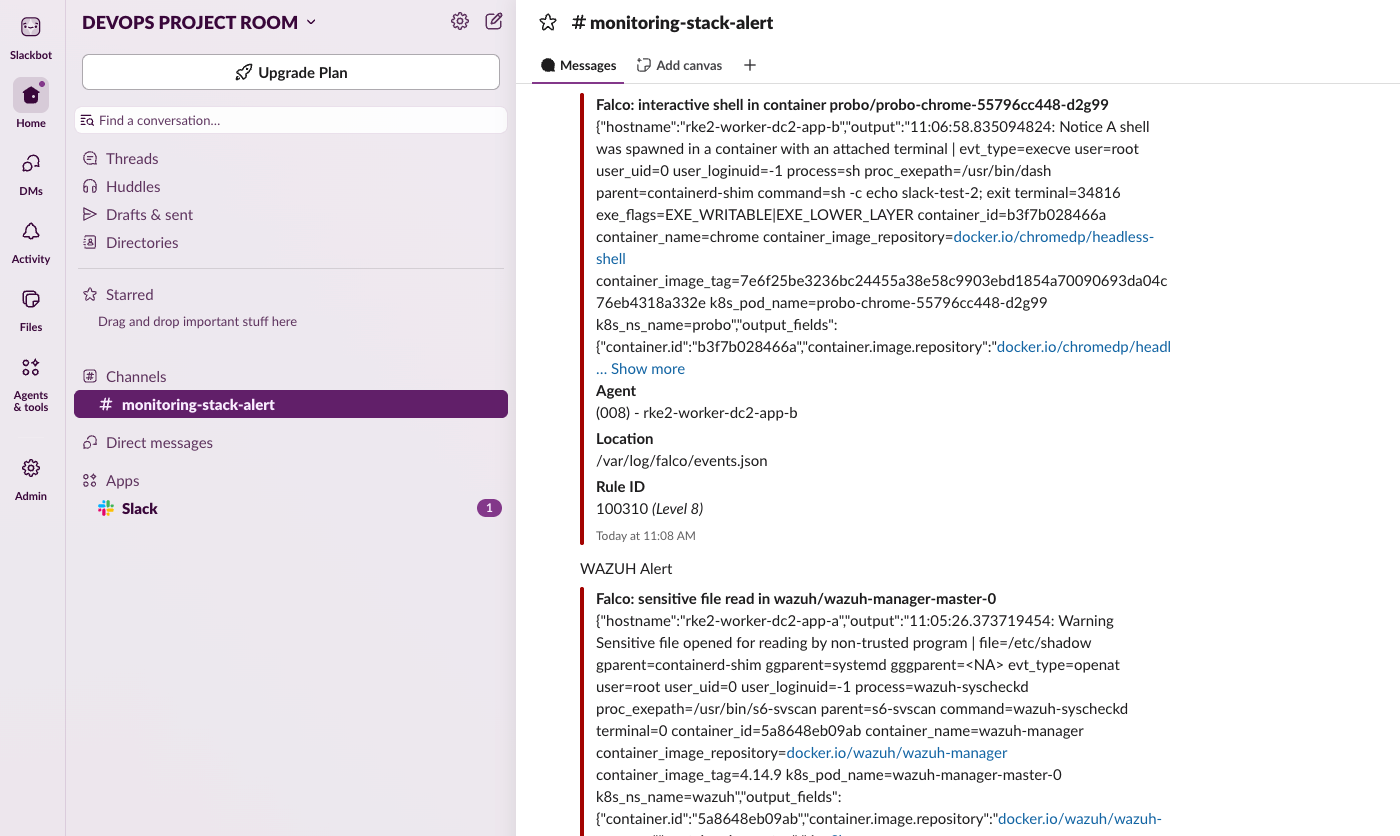
#monitoring-stack-alert: the shell test as Wazuh rule 100310, level 8, with agent and location. Below it, one of the manager start-up false alarms that the wazuh-syscheckd exemption later removed
Validation
Nothing here runs on a schedule. Falco looks at every system call as it happens. To check the whole chain, I ran three real attacks against a pod that was already in the cluster:
# Read the password hashes
kubectl -n probo exec deploy/probo-chrome -- cat /etc/shadow

# An interactive shell inside a container
script -q /dev/null kubectl -n probo exec -it deploy/probo-chrome -- sh

# Tamper with the container's configuration
kubectl -n probo exec deploy/probo-chrome -- sh -c 'echo t > /etc/falco-write-test; rm -f /etc/falco-write-test'
All three arrived in Wazuh with the right host, pod and namespace, and so did a real privileged container launch:
| Action | Falco rule | Wazuh rule | Level | MITRE |
|---|---|---|---|---|
cat /etc/shadow |
Read sensitive file untrusted | 100311 | 8 | T1003.008 |
kubectl exec -it … sh |
Terminal shell in container | 100310 | 8 | T1059 |
Write below /etc |
Write to /etc in Container | 100302 | 5 | none |
| Privileged pod replaced | Launch Privileged Container in Homelab | 100322 | 3 | T1611 |
From Falco seeing the system call to Wazuh storing the alert took 0.72 seconds.
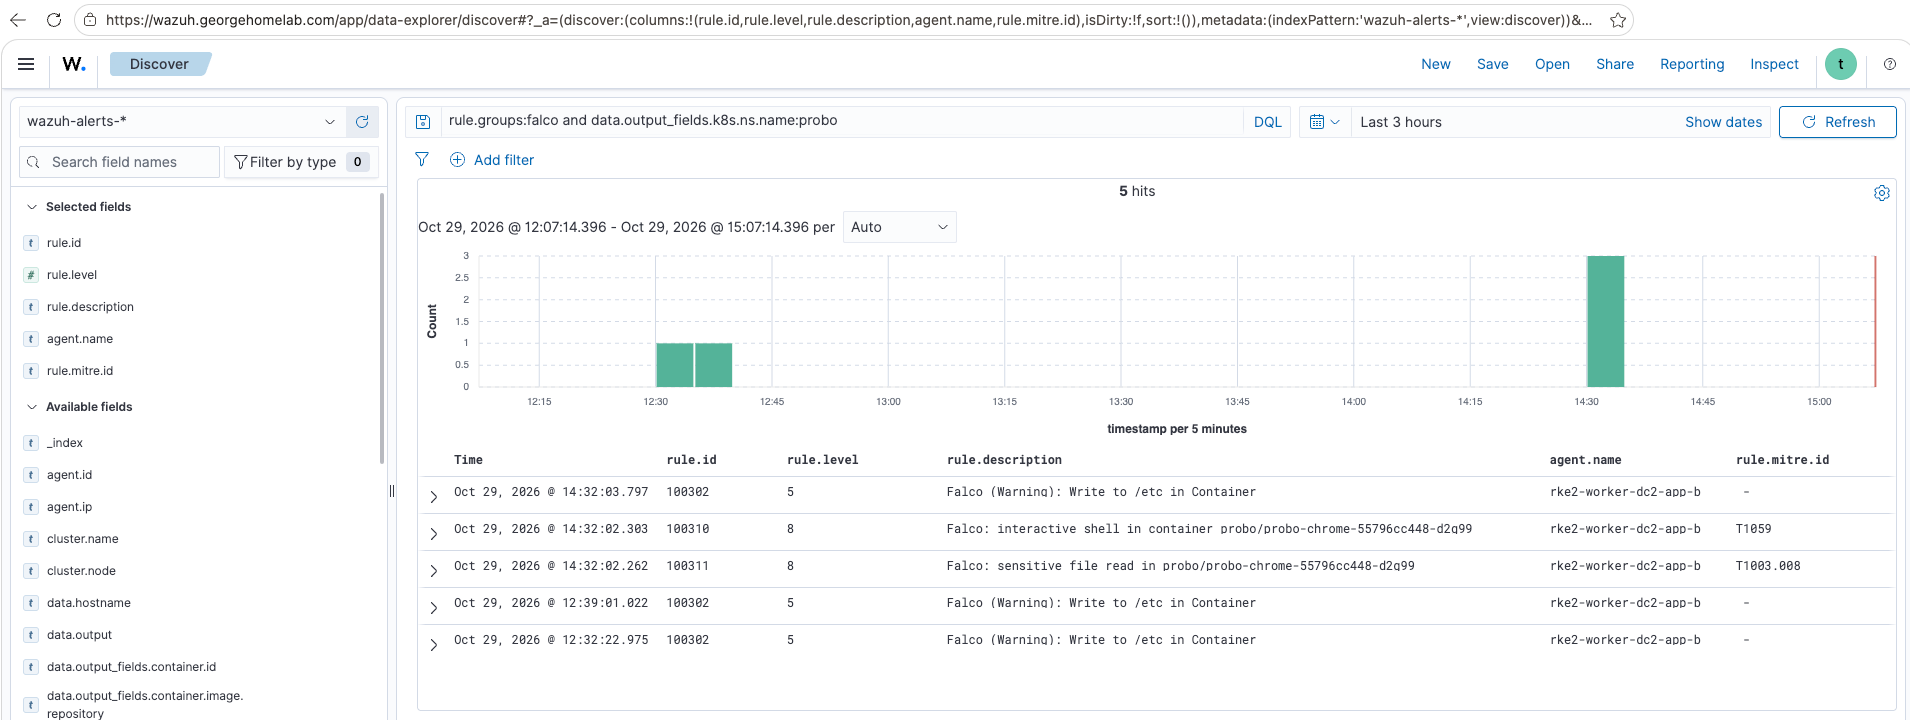
Wazuh Discover, filtered to Falco alerts from the probo namespace: the shadow read (100311, T1003.008), the interactive shell (100310, T1059) and the /etc write (100302), each tagged with the host agent that shipped it
Tuning the noise
The first hour was about 18,500 Falco alerts, nearly all of them the platform going about its normal business. Nobody can read that, so most of this project ended up being tuning.
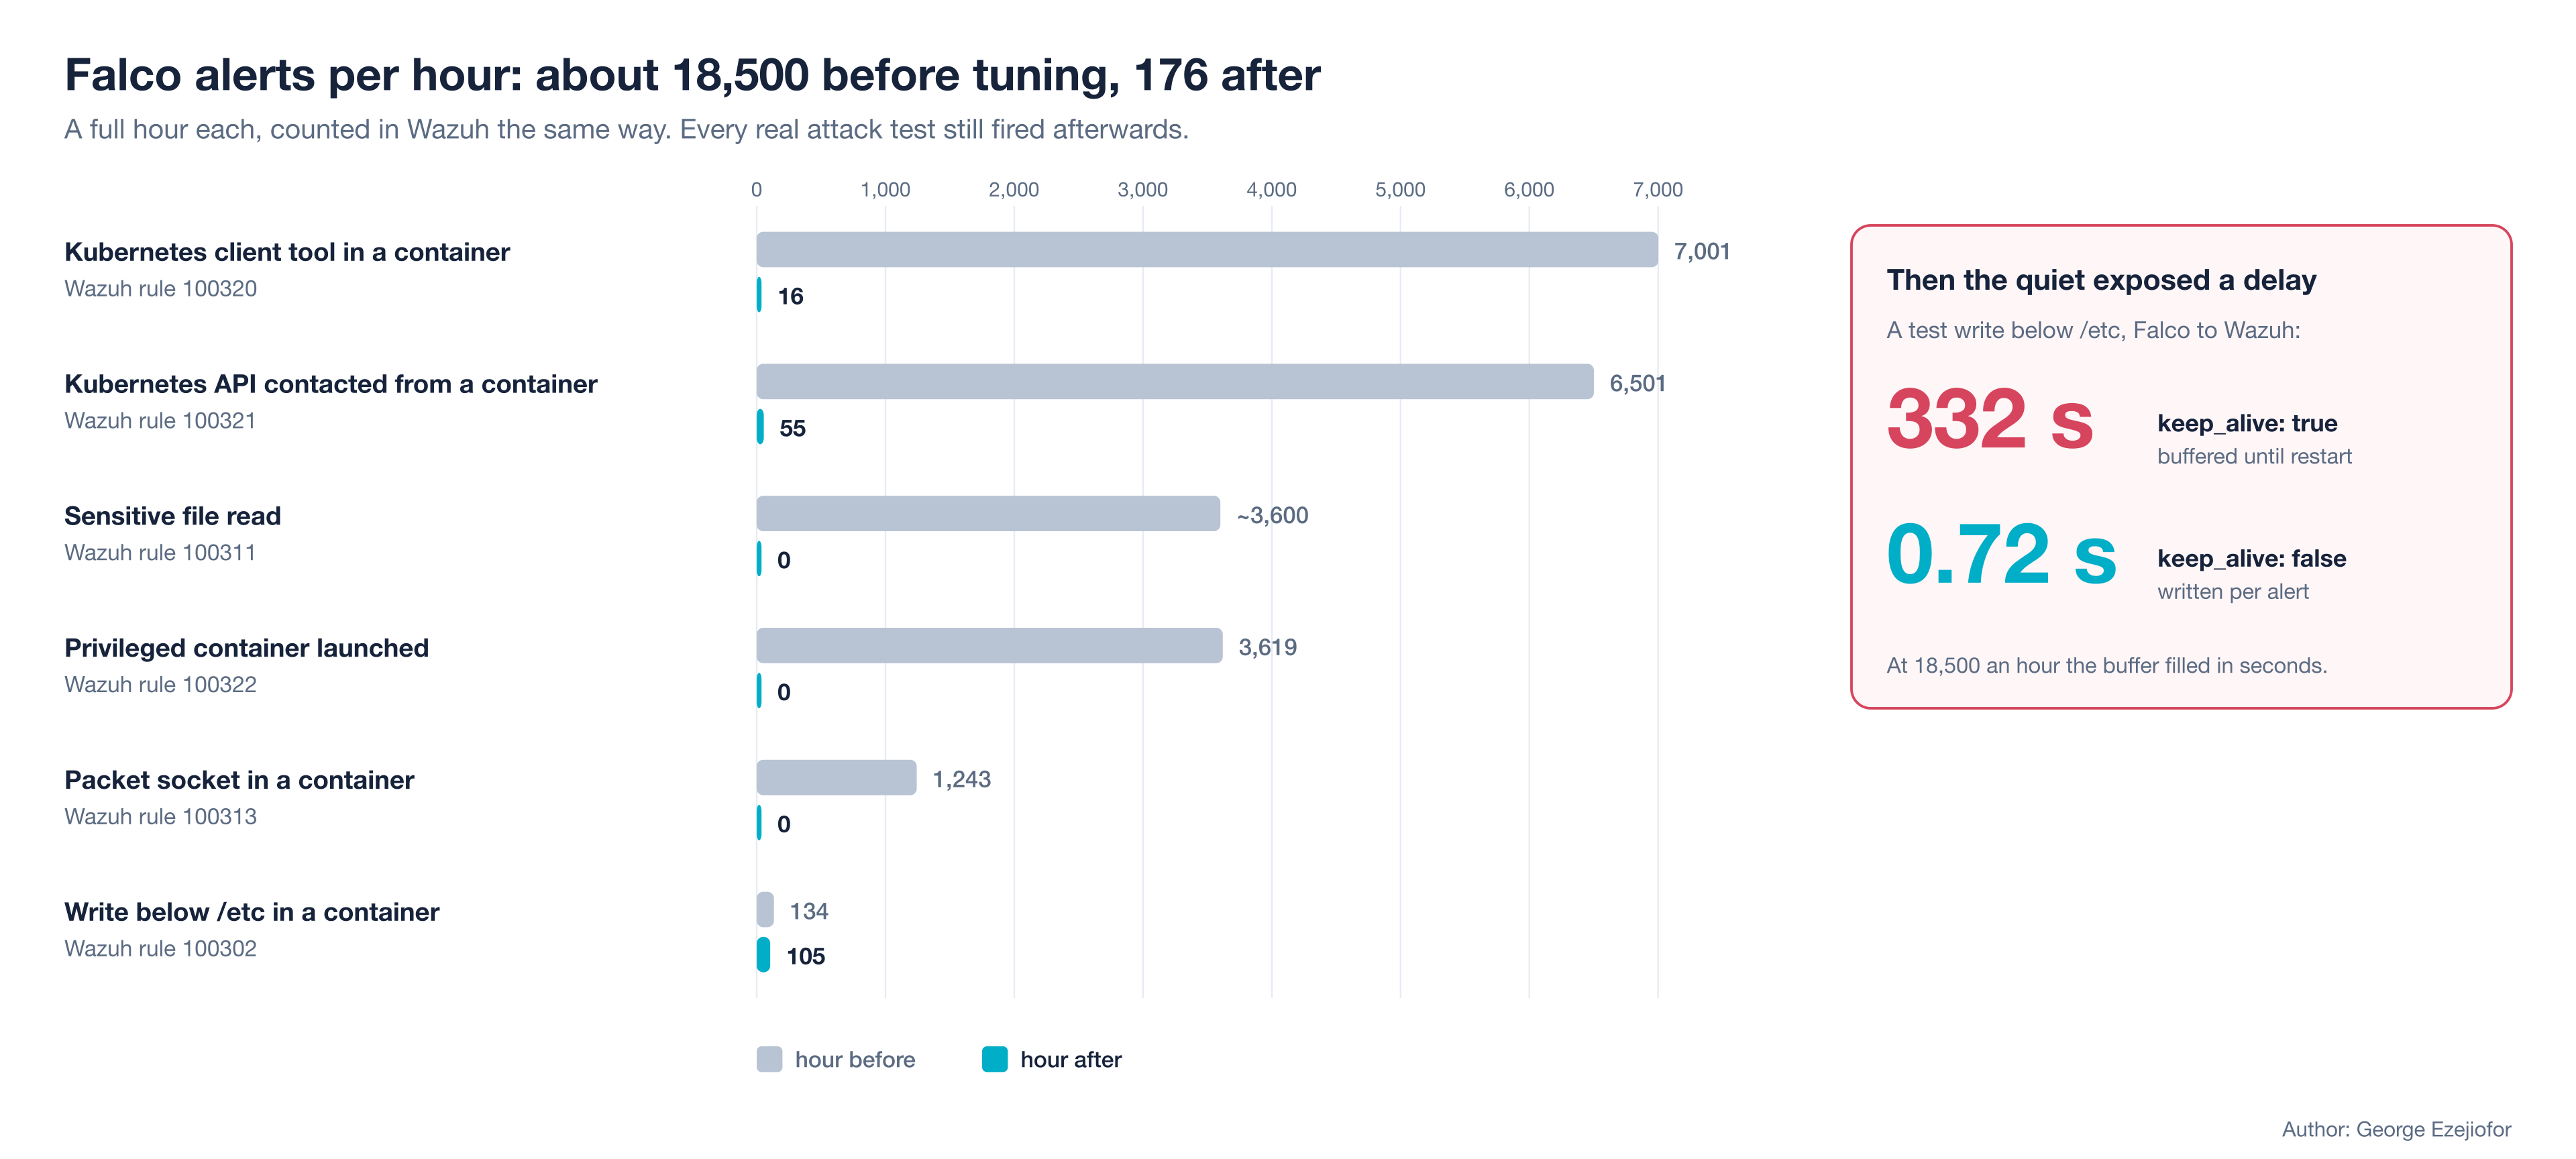
Falco alerts per hour before and after tuning, and the 332 s to 0.72 s delay fix
I used the same loop every time. Find the top image and namespace for each rule in Wazuh, decide whether it's a threat or a known workload, fix it in Git, then compare the hour before with the hour after.
The biggest single fix was embarrassing. Our own "Read Sensitive File in Container" rule listed /etc/passwd, which fired about 3,600 times an hour as MySQL, Postgres, Ceph and Trino looked up user names. That file is world-readable on purpose. I took it out and put /etc/gshadow in. Close behind it was Wazuh's own rootcheck reading /etc/shadow on every host, which is the security agent tripping the security rule. I exempted it by its executable path, /var/ossec/bin/wazuh-modulesd, rather than a process name anything could copy. Later the managers' file-integrity daemon needed the same treatment, after every manager restart posted three false alarms to Slack.
Two rules were broken in ways I'd never have guessed. "Launch Privileged Container" had no event type in its condition, so it matched every system call of a privileged container that was already running, about 3,600 times an hour from one CSI driver. Falco even warns about this at load time (LOAD_NO_EVTTYPE). It now matches only a container's first process, and deleting one of those CSI pods produced exactly one alert. The kubectl rule excluded (ci_cd_images, kubectl_images), but neither list was defined anywhere, and Falco quietly reads an undefined name as a plain string. That exclusion had never matched anything, which is why the kube-apiserver's own health probe was firing thousands of times an hour.
For everything else I exempted by namespace and image together. Controllers that talk to the Kubernetes API by design, such as Tekton, Kiali, Kyverno and Argo CD, are allowed to only in their own namespace with their own image. KubeArmor, the Prometheus config reloader and Istio's pilot-agent may write their own config below /etc, but only in their own directory. A reverse-shell rule that matched -i anywhere in a bash command had to be narrowed too, because Rook-Ceph's health probes run curl -i and produced over a thousand false Critical alerts in three hours. The last one turned up while I was writing this. Our GitHub Actions self-hosted runners download kubectl, crane and yq during a job and run them, which is exactly what Falco's "drop and execute a new binary" rule looks for. One CI run raised 594 Critical alerts, every one of which would have gone to Slack. The runners are now exempt for binaries under their own home directory, and only there.
After every change I ran the attack tests again, and they all still fired. That mattered more to me than the drop in numbers.
The same story is on a dashboard, kept in Git like everything else. A small generator writes the saved objects, and a Job imports them after every Argo CD sync.
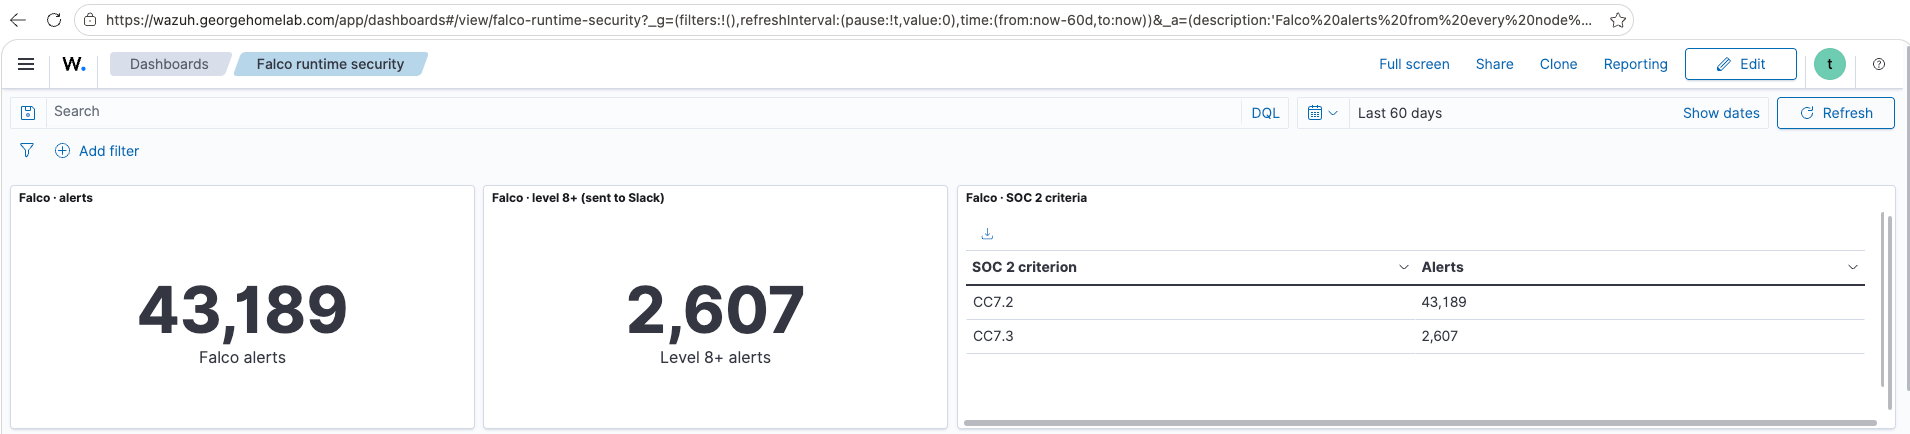
Falco runtime security: every Falco alert carries SOC 2 CC7.2; the 2,607 at level 8 and above also carry CC7.3 and go to Slack
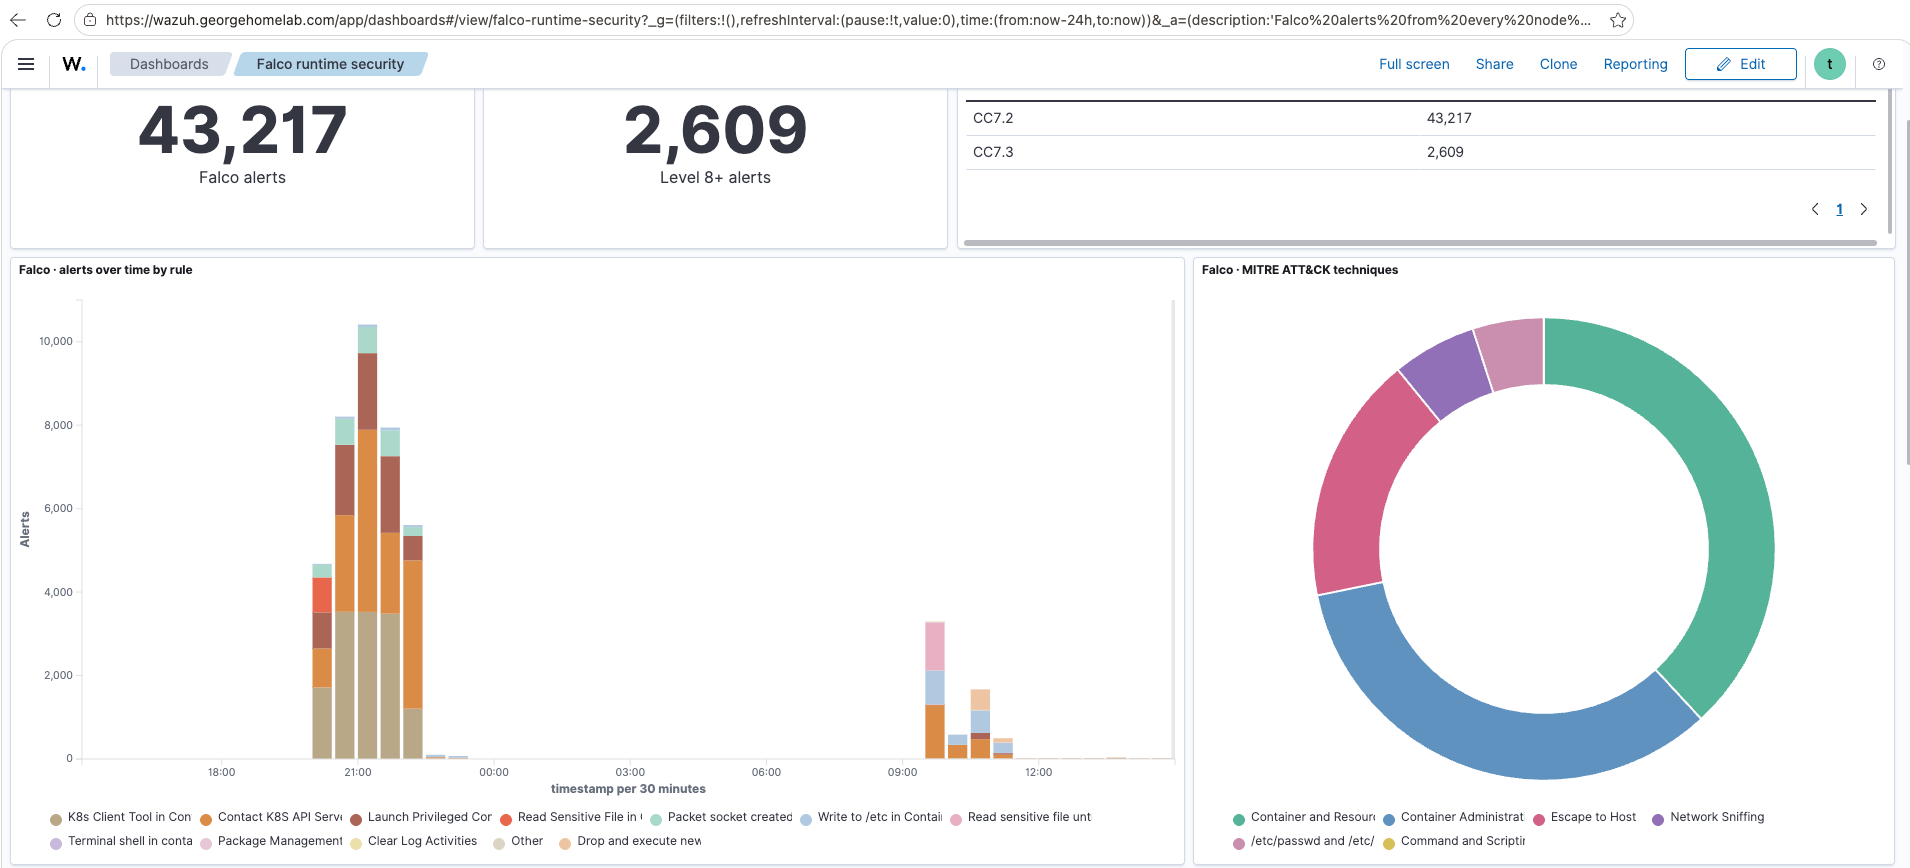
The last 24 hours in half-hour bars: about 10,000 alerts every 30 minutes before tuning, then a trickle. The MITRE techniques sit beside them
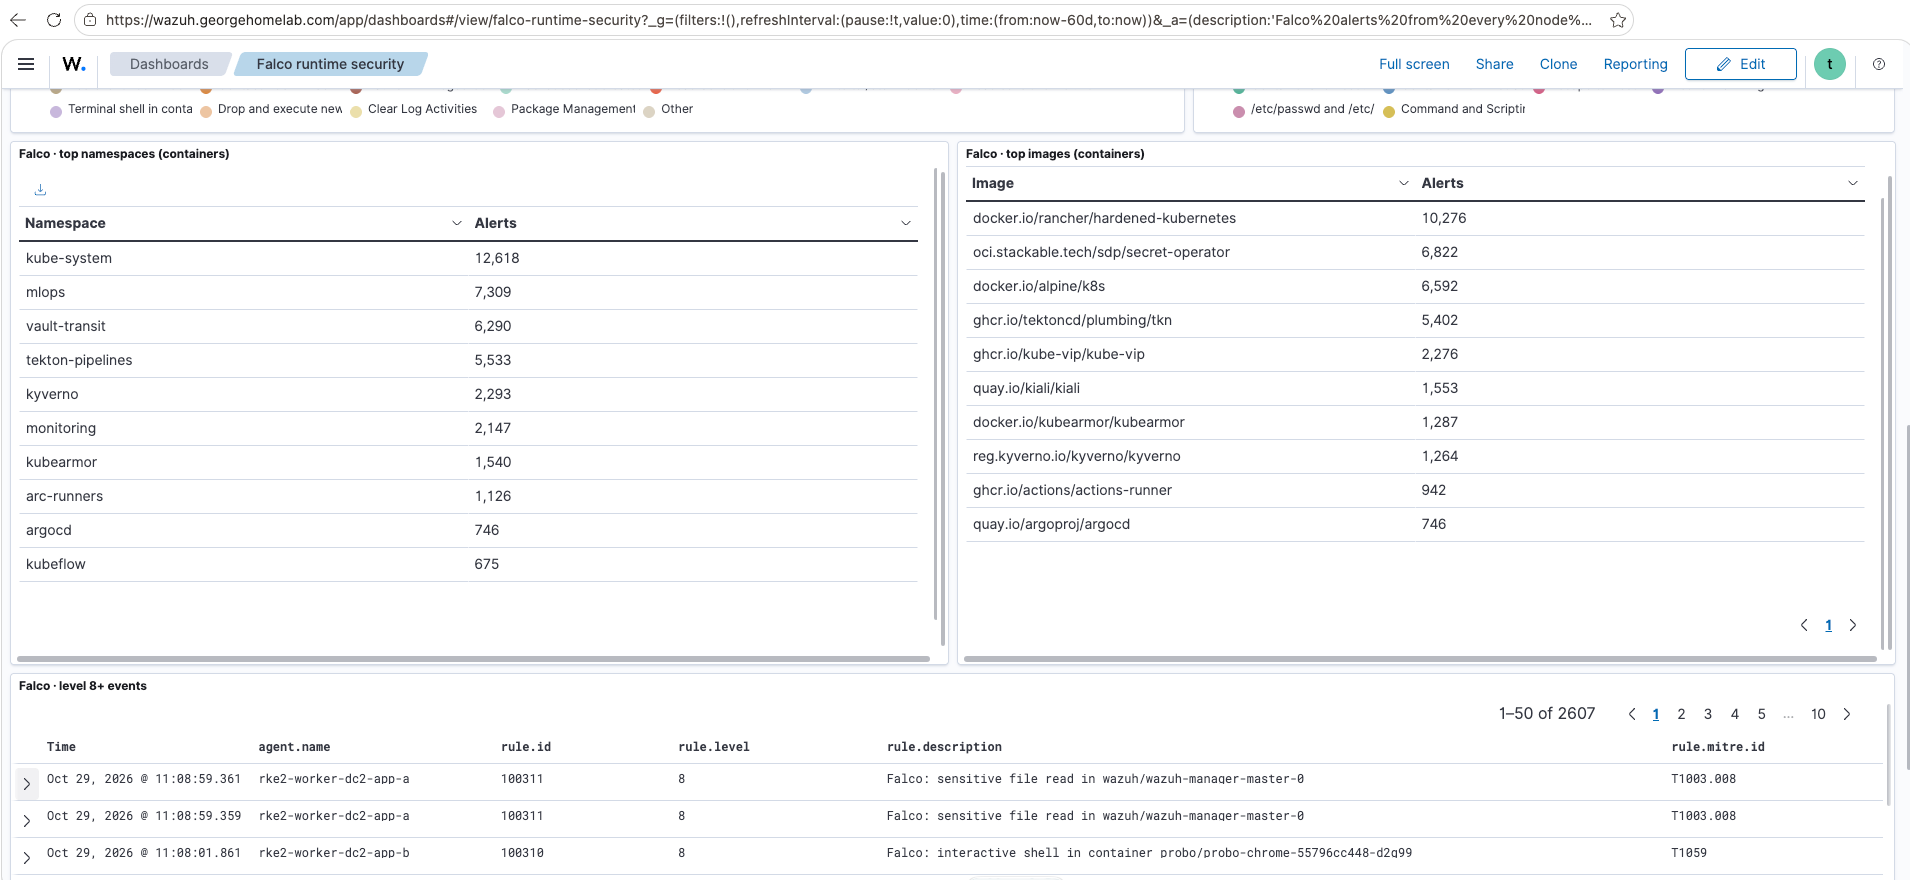
Where the alerts came from, by namespace and image, and the level 8+ events with their MITRE technique
Getting rid of the noise exposed a problem I hadn't seen before. I wrote a test file below /etc and watched it appear on Falco's stdout straight away, then waited. It reached Wazuh 332 seconds later, and only because I restarted that Falco pod. With keep_alive: true, Falco keeps the output file open and buffers its writes, even with buffered_outputs: false. At 18,500 alerts an hour the buffer filled every few seconds, so I never noticed. At a few dozen an hour, a real alert could sit there for minutes. Switching to keep_alive: false makes Falco write each alert as it happens, and the same test took 0.72 seconds. If you tune a pipeline like this, measure the timing again afterwards.
There was a nice side effect, too. Before tuning, Falco averaged 294 millicores per node. After, the same 14 pods average 28.
Compliance mapping in Wazuh
This is where the security work turns into compliance evidence. Wazuh's own ruleset tags its checks with PCI DSS, NIST 800-53, HIPAA, GDPR and SOC 2, so a failed check arrives already attached to named controls.
Here's a real one. Wazuh runs the CIS Ubuntu 24.04 benchmark on every host agent, and this check fails on all 20 of my RKE2 VMs:
| Field | Value |
|---|---|
| Check | CIS Ubuntu Linux 24.04 LTS 3.3.5: Ensure ICMP redirects are not accepted |
| Wazuh rule | 19007, level 7 |
| SOC 2 | CC6.3, CC6.6, CC7.1, CC7.2 |
| PCI DSS v4 | 1.2.5, 2.2.4, 6.4.1 |
| ISO 27001:2013 | A.13.1.3 |
| NIST 800-53 | CM.1 |
| MITRE ATT&CK | T1557, mitigations M1030 and M1042 |
That's as far as Wazuh goes. It produces the mapped technical evidence, but it doesn't track who owns a control or what an auditor has already seen. For that I use Probo.
Evidence in Probo
Probo is an open-source compliance tool. It runs in the same cluster and signs in through Keycloak with SAML. Its frameworks come with their controls already written, and I added all 13 to my organisation, 1,008 controls in total:
| Framework | Controls | Measures linked |
|---|---|---|
| SOC 2 | 61 | 11 |
| PCI DSS | 331 | not yet |
| ISO 27001 (2022) | 123 | not yet |
| ISO 27701 (2025) | 108 | not yet |
| ISO 42001 (2023) | 70 | not yet |
| DORA | 65 | not yet |
| GDPR | 62 | not yet |
| HIPAA | 60 | not yet |
| HDS | 31 | not yet |
| FERPA | 29 | not yet |
| 21 CFR Part 11 | 28 | not yet |
| CCPA | 23 | not yet |
| NIS 2 | 17 | not yet |
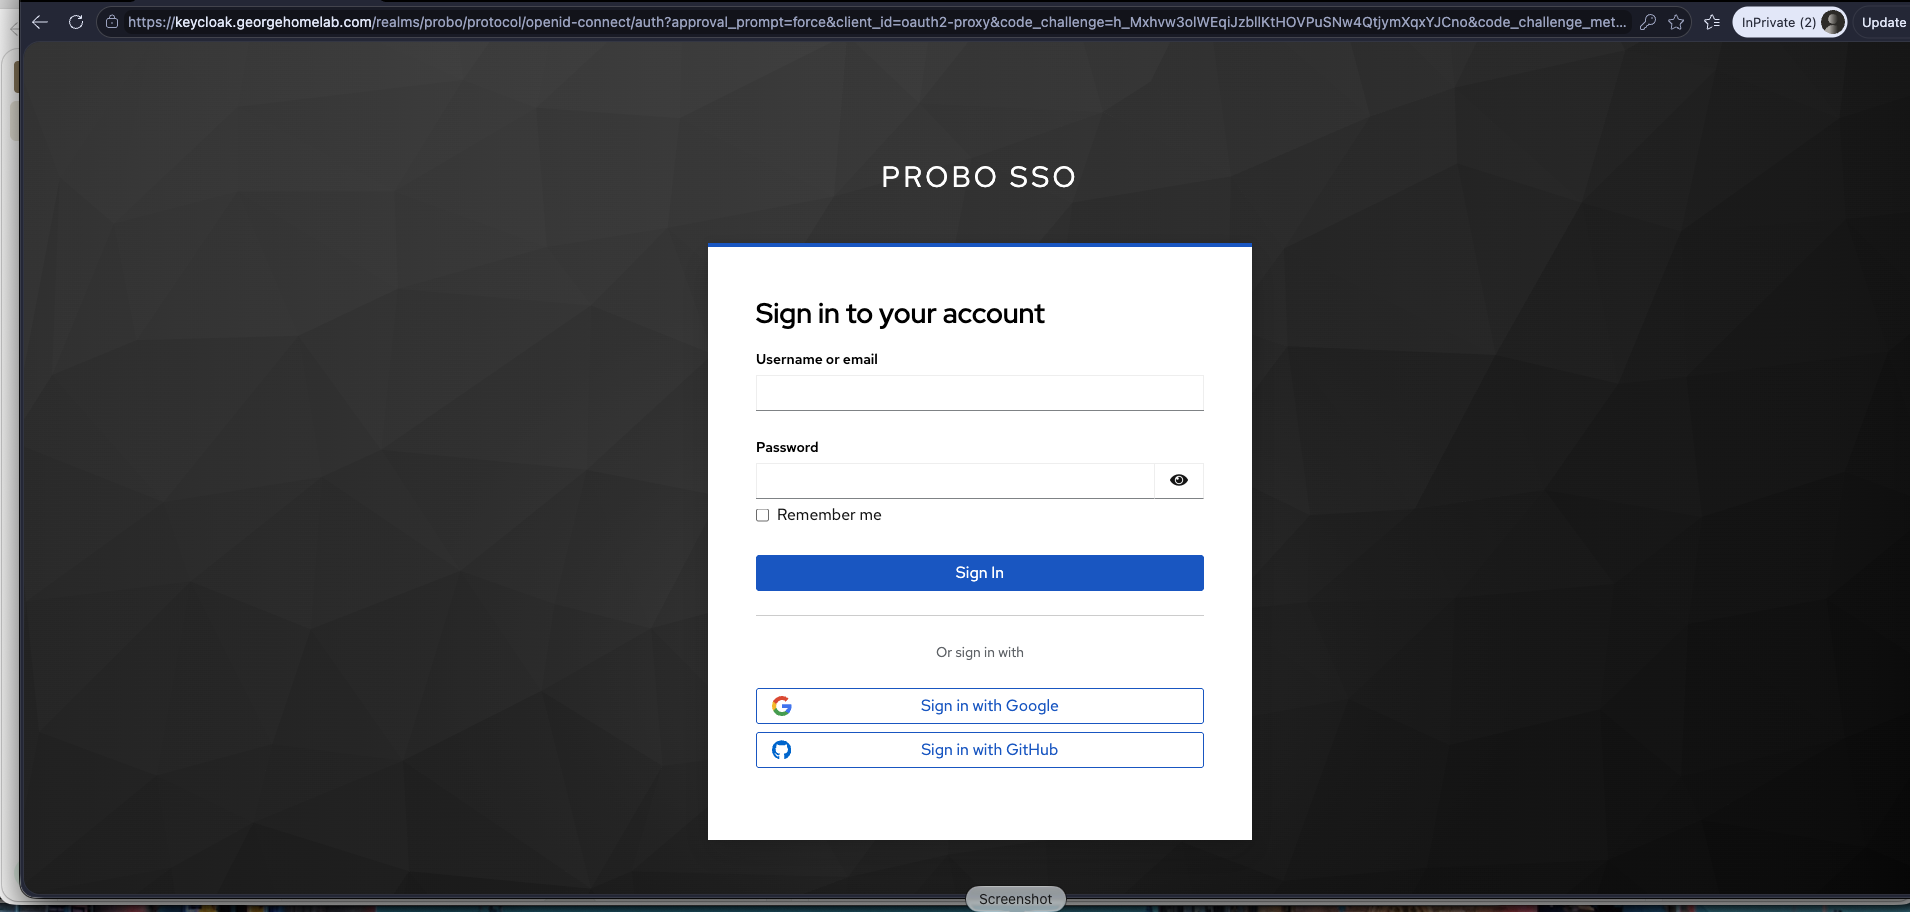
Keycloak realm Probo: sign in with Google or GitHub; only allow-listed emails get through
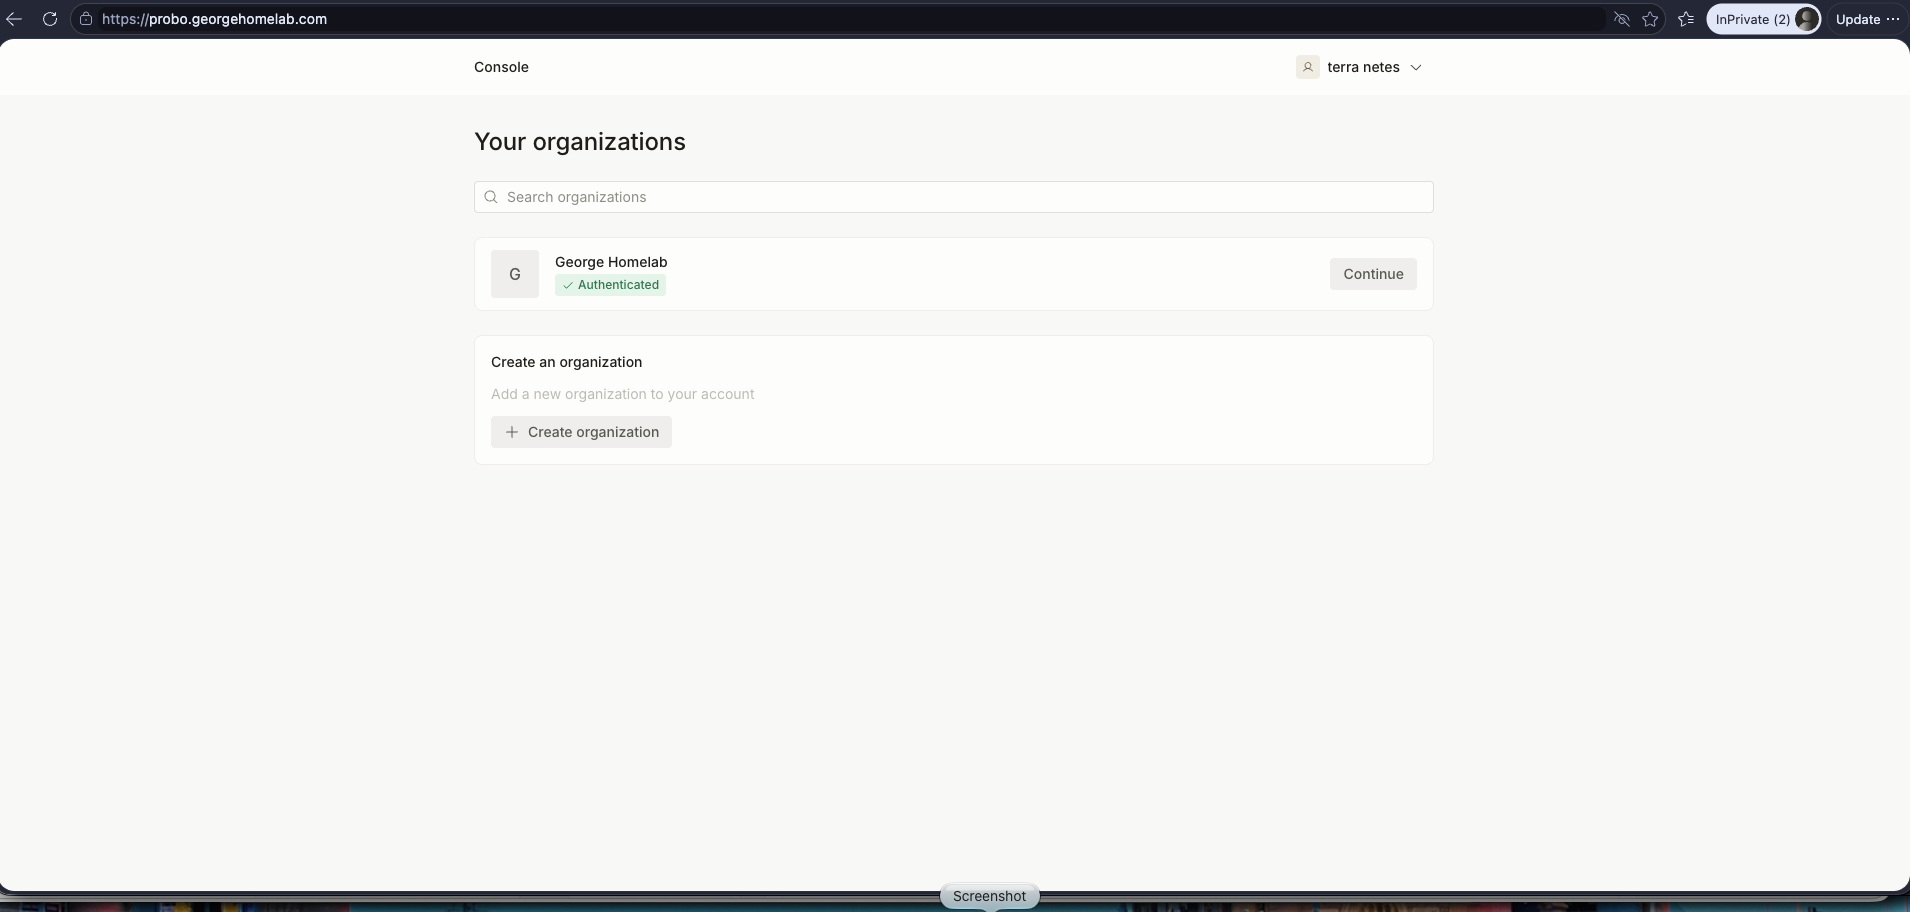
Created George Homelab as organisation
I started with SOC 2, because Wazuh already tags every alert with its criteria.
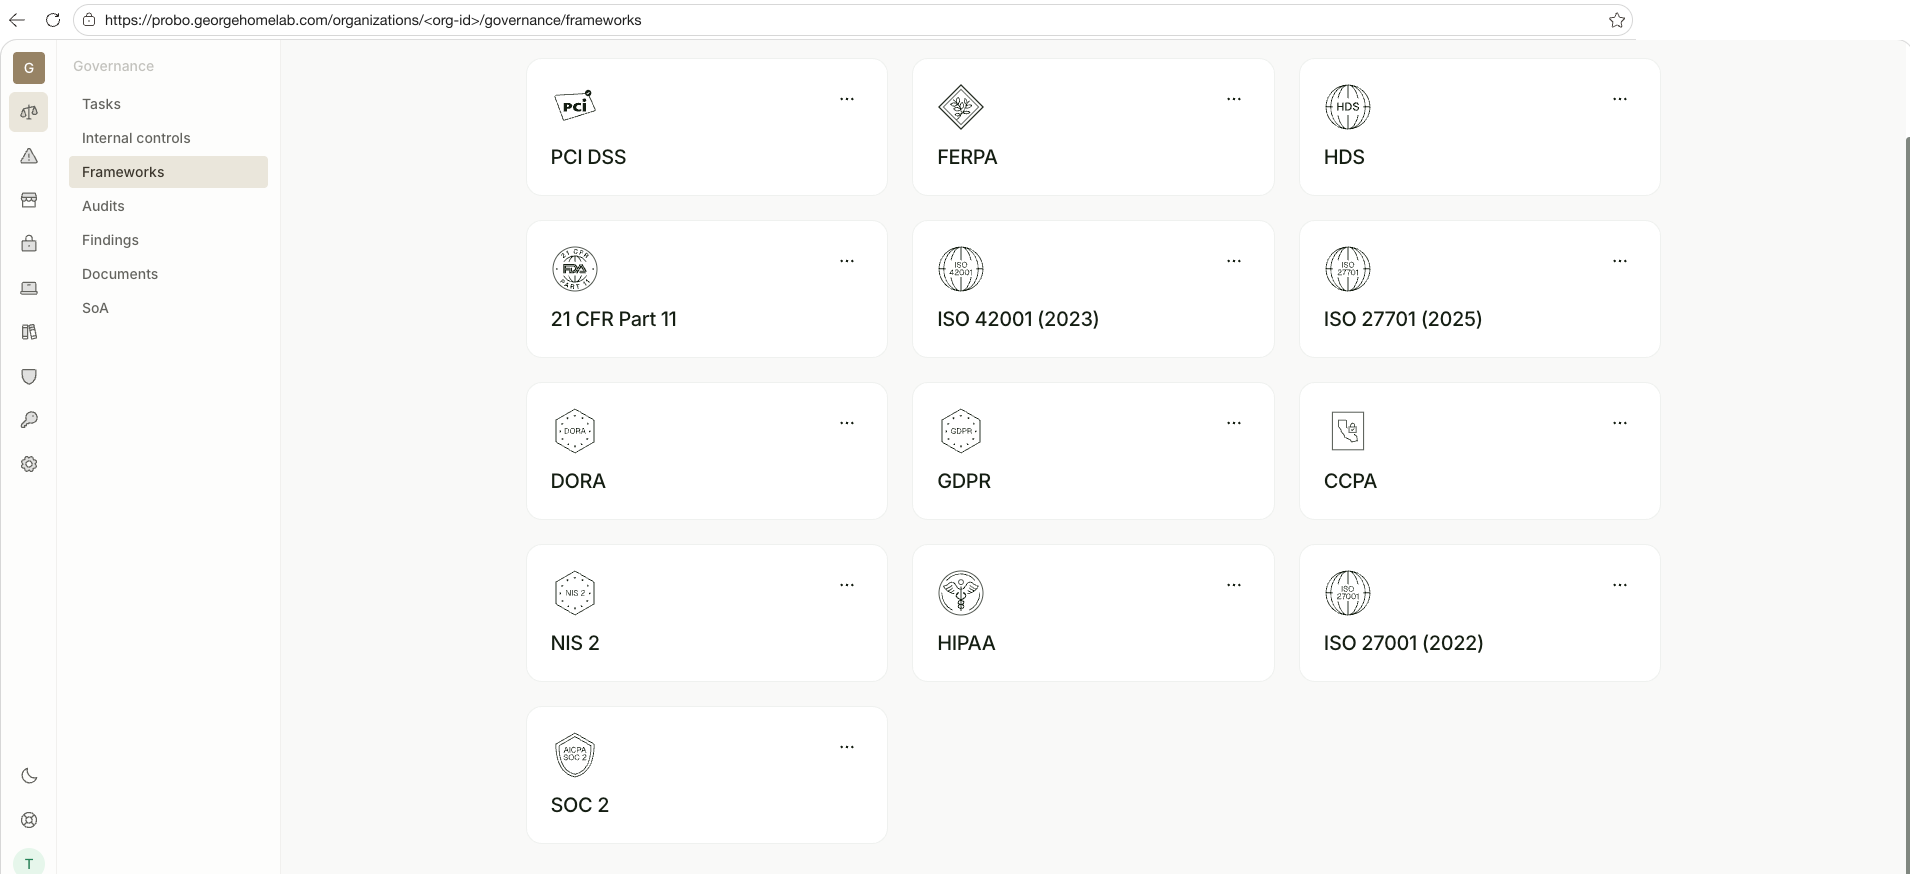
The 13 frameworks added to my Probo organisation; only SOC 2 has measures linked so far
In Probo, each control the platform really runs becomes a measure, linked to the criteria it answers. I didn't want to click those together in a UI, so they live in a YAML file in Git:
- code: IC-MON-01
  name: Runtime threat detection (Falco → Wazuh)
  category: Monitoring
  control_type: DETECTIVE
  operating_frequency:
    mode: CONTINUOUS
  implementation_status: OPERATING
  soc2:
    - CC7.2
    - CC7.3
A short script, probo-sync.py, reads that file and talks to Probo's MCP API. It shows a plan first, only applies with --apply, and never deletes anything. The first run created 11 measures and 19 links, covering runtime detection, host assessment, sign-in, secrets, network segmentation, admission policy, GitOps change control, the image supply chain and tested backups. Where I know a measure has a gap, it says "in progress". When I add ISO 27001, I'll link the same measures to its controls. The evidence doesn't change, only the framework it's mapped to.
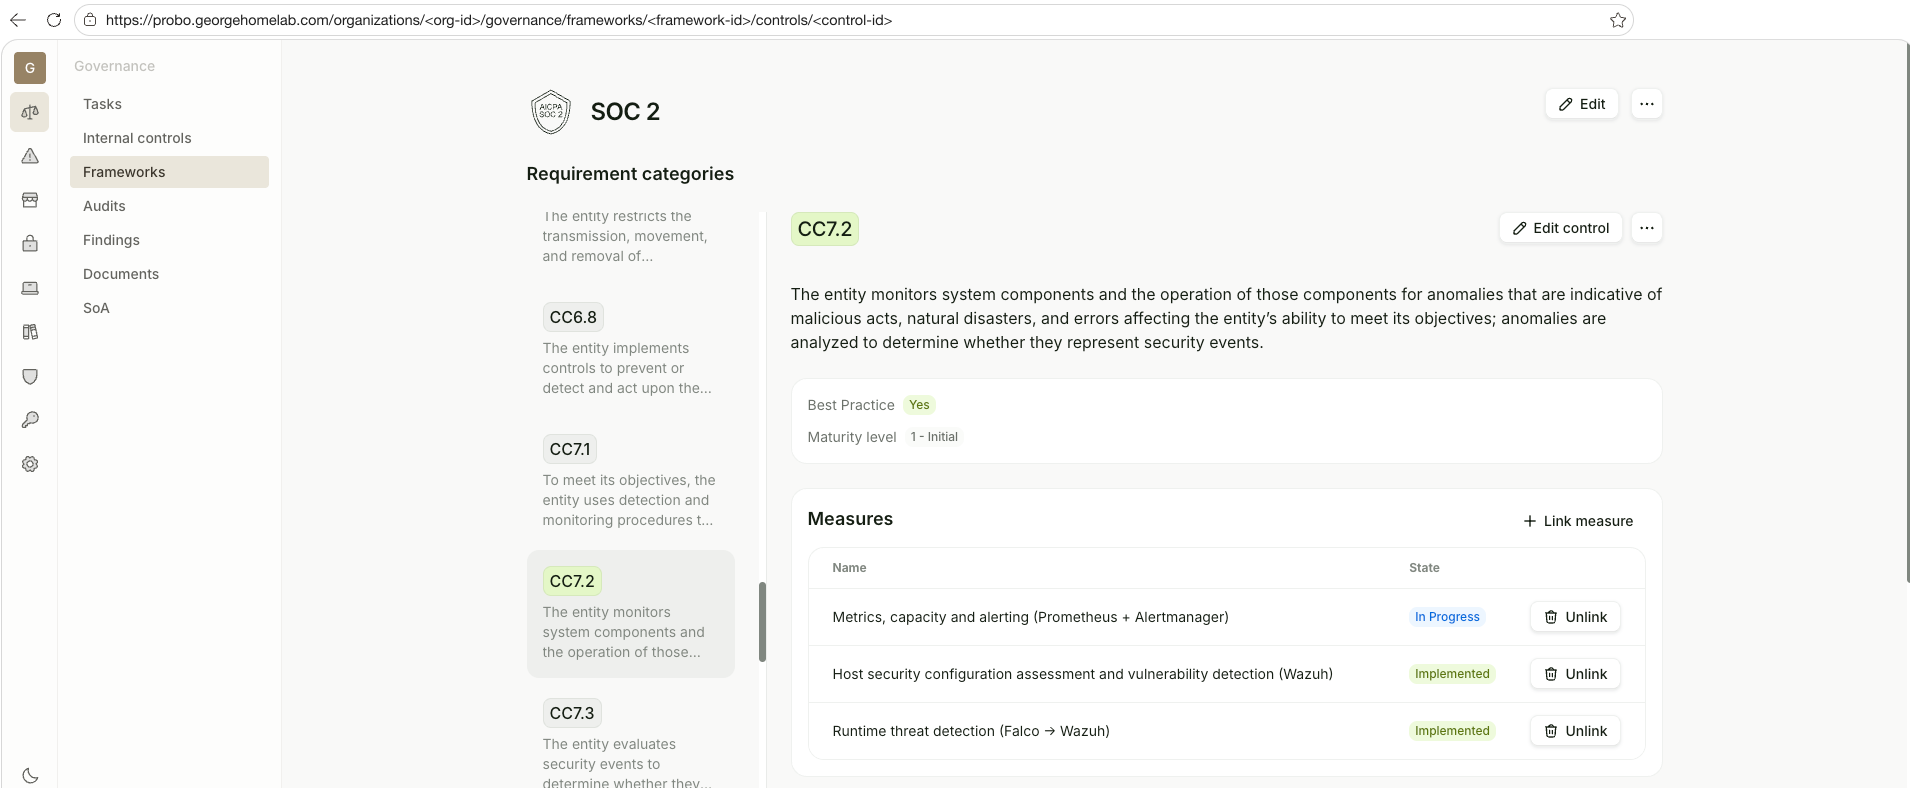
SOC 2 control CC7.2 in Probo, answered by three measures: runtime threat detection and the Wazuh host assessment, both implemented, and Prometheus alerting, still in progress
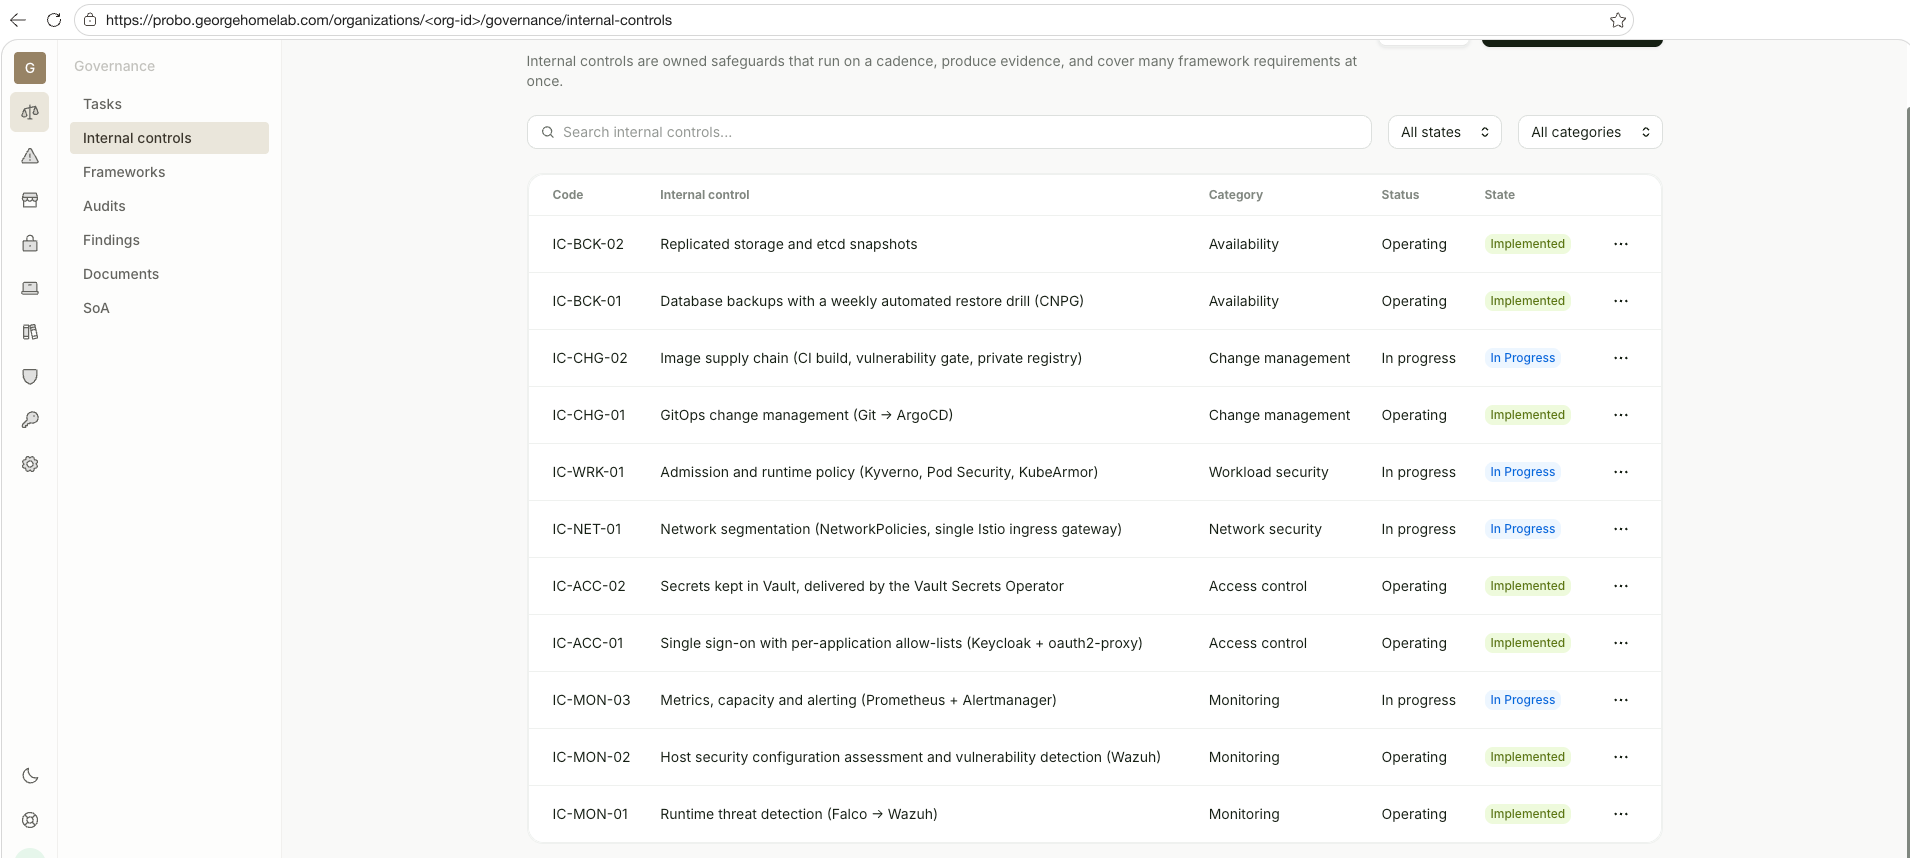
All 11 measures in Probo, created from soc2-mapping.yaml: seven implemented, four still in progress where I know there's a gap
One event, end to end
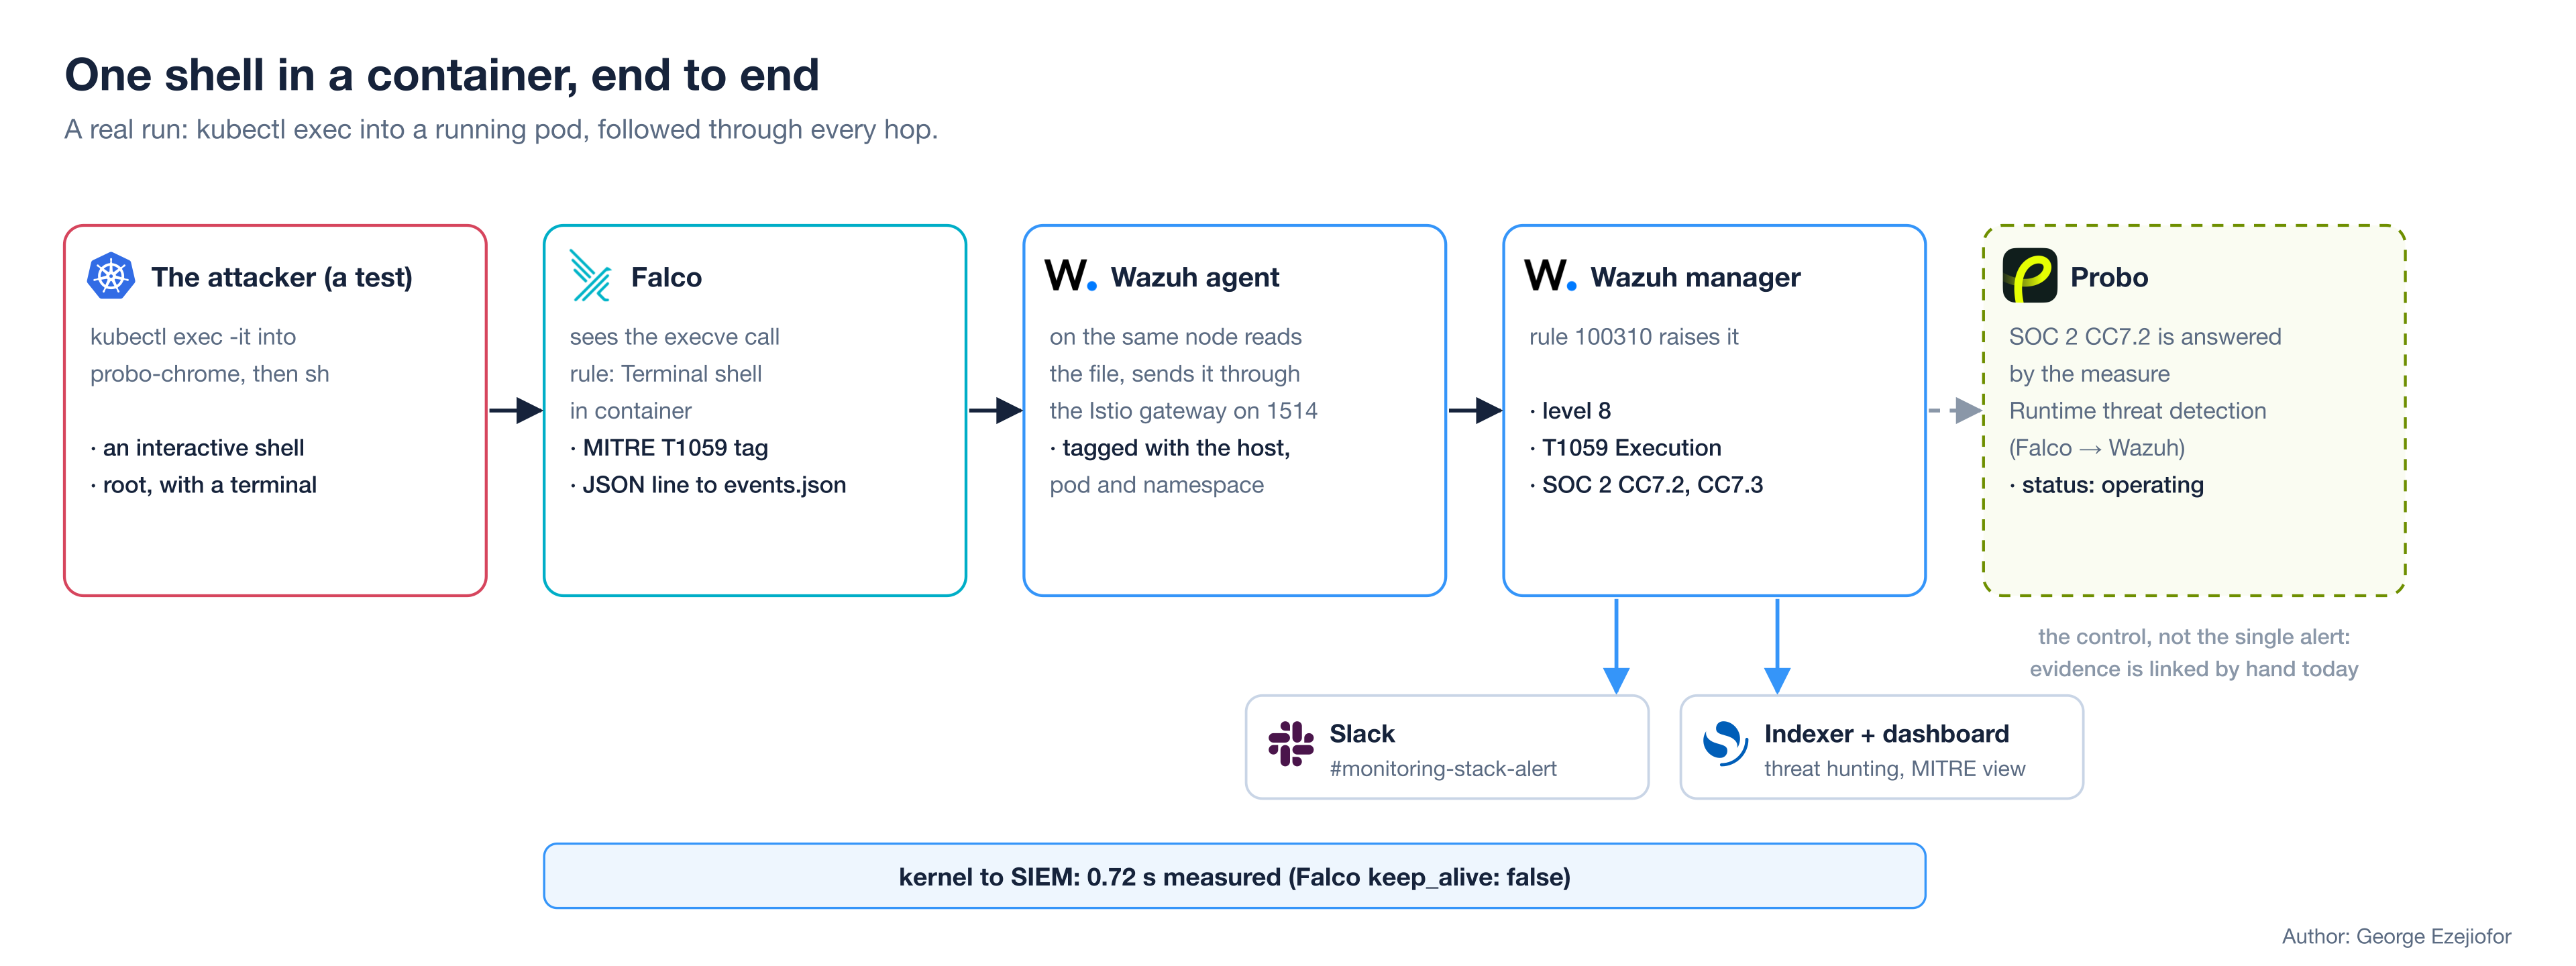
One shell in a container, from the system call to Slack and the SOC 2 control
Following one shell through the whole chain: Falco matches "Terminal shell in container" on the node where the pod runs. The Wazuh agent on that node reads the JSON line and sends it through the Istio gateway on port 1514. The manager applies rule 100310, which makes it level 8 and tags it T1059 and SOC 2 CC7.2 and CC7.3. The alert is stored 0.72 seconds after the system call and posted to Slack. In Probo, CC7.2 is answered by the runtime detection measure, which names this pipeline as its evidence.
The last step is the weak one. The measure shows the control exists and runs, but one alert doesn't flow into Probo by itself. That's what I'll build next.
How reliable is it?
The lab powers off every night and cold-boots every morning, so every part of this restarts from scratch daily, which turns out to be a decent test in itself.
| What goes wrong | What happens | Evidence |
|---|---|---|
| All three hosts cold-boot | Wazuh, Falco and Probo come back with no manual step | 23 agents active and 3 indexers green after the morning boot |
| A Wazuh manager restarts | Its agents reconnect to the managers still running | All three managers restarted one after another: all 23 agents reconnected, and every test alert sent during the restarts arrived |
| Falco restarts on every node (14 pods) | Each pod is replaced in turn and picks up where it stopped | Several rolling restarts during tuning; every attack test run afterwards fired |
| An indexer pod dies | The cluster drops to yellow, never red, and alerts keep landing. The pod is back in about 10 seconds | Green again 60 seconds after the delete; an attack test sent during the outage was stored 0.21 s after Falco saw it. The first run went red: Wazuh creates its inventory and vulnerability indices with 0 replicas. An hourly job now keeps one replica on them |
| One Proxmox host goes down | [PENDING: shut down one host, check agents fail over to the remaining workers and the indexer keeps 2 of 3] | [PENDING] |
What this doesn't do
CrowdStrike sells more than a sensor. You also get managed threat hunting and threat intelligence drawn from their whole customer base. Falco and Wazuh give me the detection, but none of that service.
Detection is automatic here, and response isn't. When an alert lands in Slack, a person decides what happens next. Falco Talon could kill a pod on its own, but I haven't deployed it.
Vanta collects evidence through hundreds of integrations. Here, only the measures are synced from Git, and linking evidence is still manual. Only SOC 2 is mapped so far. The other 12 frameworks are in Probo with all their controls, waiting. Kyverno's policy reports don't reach Wazuh yet either, so I can't show a compliance score per framework the way Azure Policy can, and the admission measure stays "in progress". Falco also isn't running on the database and GPU nodes yet; it covers 14 of the 20 VMs until I add tolerations for those pools.
And you run all of it yourself. Upgrades, storage, certificates and noise tuning are your job. The tuning section above is a fair picture of what that takes.
Cost and sovereignty
There's no licence fee. What it costs is the capacity it uses, measured on the live cluster:
| Component | Footprint |
|---|---|
| Wazuh: 3 indexers, 3 managers, dashboard | about 7 GiB memory, under 0.1 CPU core idle |
| Wazuh storage on Ceph | 3 × 30Gi indexer, 3 × 40Gi manager |
| Falco on 14 nodes | about 28 millicores per node after tuning |
| Probo with its Postgres | about 0.5 GiB memory |
Here's roughly what the same coverage would cost from the vendors, at their published or reported prices:
| Product | Price basis | For this lab |
|---|---|---|
| CrowdStrike Falcon Enterprise (the tier with full EDR) | $184.99 per device per year, list price (CrowdStrike pricing) | 23 hosts: about $4,250 a year. Container and Kubernetes protection is priced separately and isn't published |
| Vanta | No published price. Median contract $20,000 a year; $12,000 to $28,000 for 1 to 50 employees on one framework (Vendr, from anonymised purchases) | at least $12,000 a year, plus the auditor: $8,000 to $25,000+ for SOC 2, not included |
| Azure Arc + Azure Policy | Kubernetes configuration: first 6 vCPUs free per subscription; Azure Policy guest configuration $6 per server per month outside Azure; other Azure Policy at no extra cost (Azure Arc pricing) | the smallest line, but every policy and audit log then lives in Azure |
That comes to $16,000 or more a year for a homelab, before anyone has paid an auditor. Self-hosting doesn't get rid of the auditor either.
It doesn't get rid of the penetration test, either. PCI DSS still wants one every year, plenty of customers ask for the report, and third-party testers aren't cheap. In my experience, even moving a booked pentest to another date can cost 25% of the fee. What this stack changes is what you're paying the tester for. The findings a scanner would hand you, like the ICMP-redirect check failing on every node, are fixed before anyone arrives, so the hours go into the problems only a person can find. And while they work, every technique they try should show up in Wazuh and in Slack, which turns the pentest into a test of your detection as well.
For me, though, the stronger reason is sovereignty. My security telemetry and compliance evidence never leave my hardware. No third party processes them, so the question of cross-border transfers never comes up.
That carries more weight in the EU. DORA makes financial firms manage the risk of every ICT provider they rely on and keep a register of them. NIS 2 asks essential and important entities to secure their supply chain and to report a significant incident with an early warning within 24 hours and a fuller notification within 72. A self-hosted stack means fewer providers on that register, and the logs you'd report from stay on your own hardware. Probo ships both frameworks, too.
What's Next?
The next piece closes the gap in that last step: a small job that pushes Wazuh alert counts for each SOC 2 criterion into Probo as evidence, so the audit view updates itself. After that I'll send Kyverno's policy reports into Wazuh, give Falco tolerations for the database and GPU nodes, and link ISO 27001 to the measures that already exist.
This is the part of the platform that proves the rest of it to someone looking in from outside: the Terraform, RKE2 with Ansible, the hardening series, the signed supply chain, storage, Vault and observability. It does live detection, mapped evidence and audit tracking, all in Git, all on hardware I control.
To follow the rest of this build, 🚀 Follow me on LinkedIn
Author: George Ezejiofor
About the author
- I'm an AI/ML Platform and MLOps Engineer and a Kubestronaut, with 13+ years in IT and 5+ in DevOps and DevSecOps. Through my consultancy, GeoCloudTech, I design secure, highly available Kubernetes platforms for regulated industries, on cloud and on-premises. What I build: - Kubernetes platforms: RKE2, AKS, EKS, GKE - MLOps: Kubeflow, KServe, MLflow, NVIDIA GPU Operator - DevSecOps: Vault, Kyverno, KubeArmor, Trivy, signed supply chains with Tekton and Cosign - GitOps and automation: Argo CD, Flux, Terraform, Ansible - Storage and identity: Rook Ceph, CloudNativePG, Keycloak - Observability and networking: Prometheus, OpenTelemetry, Cilium, Istio Most of what I publish comes from my multi-datacentre homelab: RKE2 on Proxmox, run through GitOps. My rule: build it, break it, understand it, then harden it. Every article is a real build, traps included. Certifications: Kubestronaut (CKA, CKAD, CKS, KCNA, KCSA), HashiCorp Terraform Associate.
Comments
Join the discussionNo comments yet. Be the first to comment.