NVIDIA GPU Operator on RKE2: Passthrough to kubeflow (The Sports Car in the Garage)
As a Senior DevSecOps Engineer, I’m dedicated to building secure, resilient, and scalable cloud-native infrastructures tailored for modern applications. With a strong focus on microservices architecture, I design solutions that empower development teams to deliver and scale applications swiftly and securely. I’m skilled in breaking down monolithic systems into agile, containerised microservices that are easy to deploy, manage, and monitor.
Leveraging a suite of DevOps and DevSecOps tools—including Kubernetes, Docker, Helm, Terraform, and Jenkins—I implement CI/CD pipelines that support seamless deployments and automated testing. My expertise extends to security tools and practices that integrate vulnerability scanning, automated policy enforcement, and compliance checks directly into the SDLC, ensuring that security is built into every stage of the development process.
Proficient in multi-cloud environments like AWS, Azure, and GCP, I work with tools such as Prometheus, Grafana, and ELK Stack to provide robust monitoring and logging for observability. I prioritise automation, using Ansible, GitOps workflows with ArgoCD, and IaC to streamline operations, enhance collaboration, and reduce human error.
Beyond my technical work, I’m passionate about sharing knowledge through blogging, community engagement, and mentoring. I aim to help organisations realize the full potential of DevSecOps—delivering faster, more secure applications while cultivating a culture of continuous improvement and security awareness.

Episode 7 of the homelab build series. The foundation is poured, the walls are up, the alarms are wired, the storage floor is down and the safe is locked. Now for the fun room: three NVIDIA GPUs, one in each machine, so GPU capacity stays highly available when any one of them is down, managed by the NVIDIA GPU Operator and wired into Kubeflow.
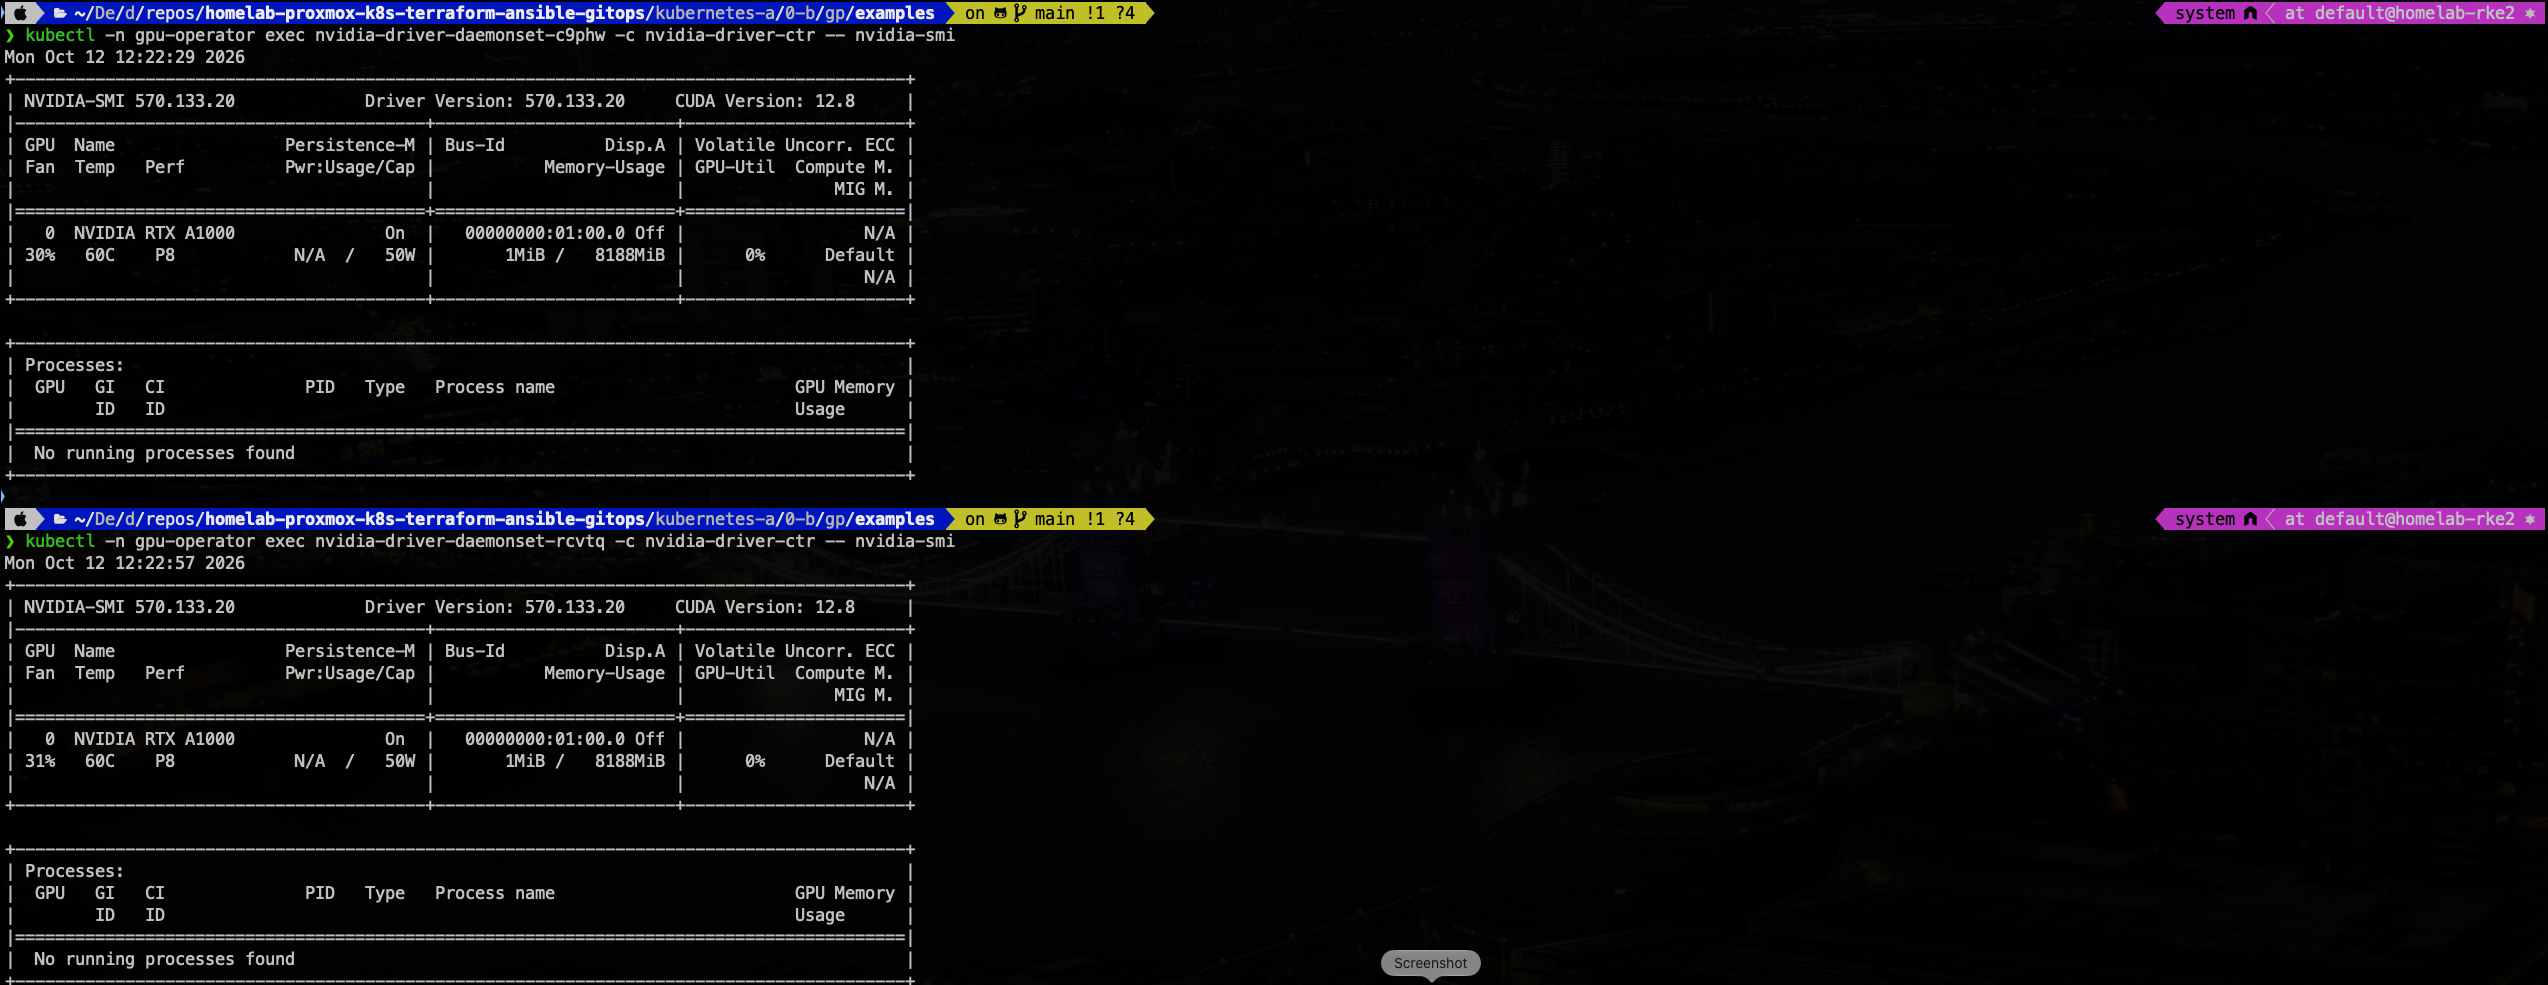
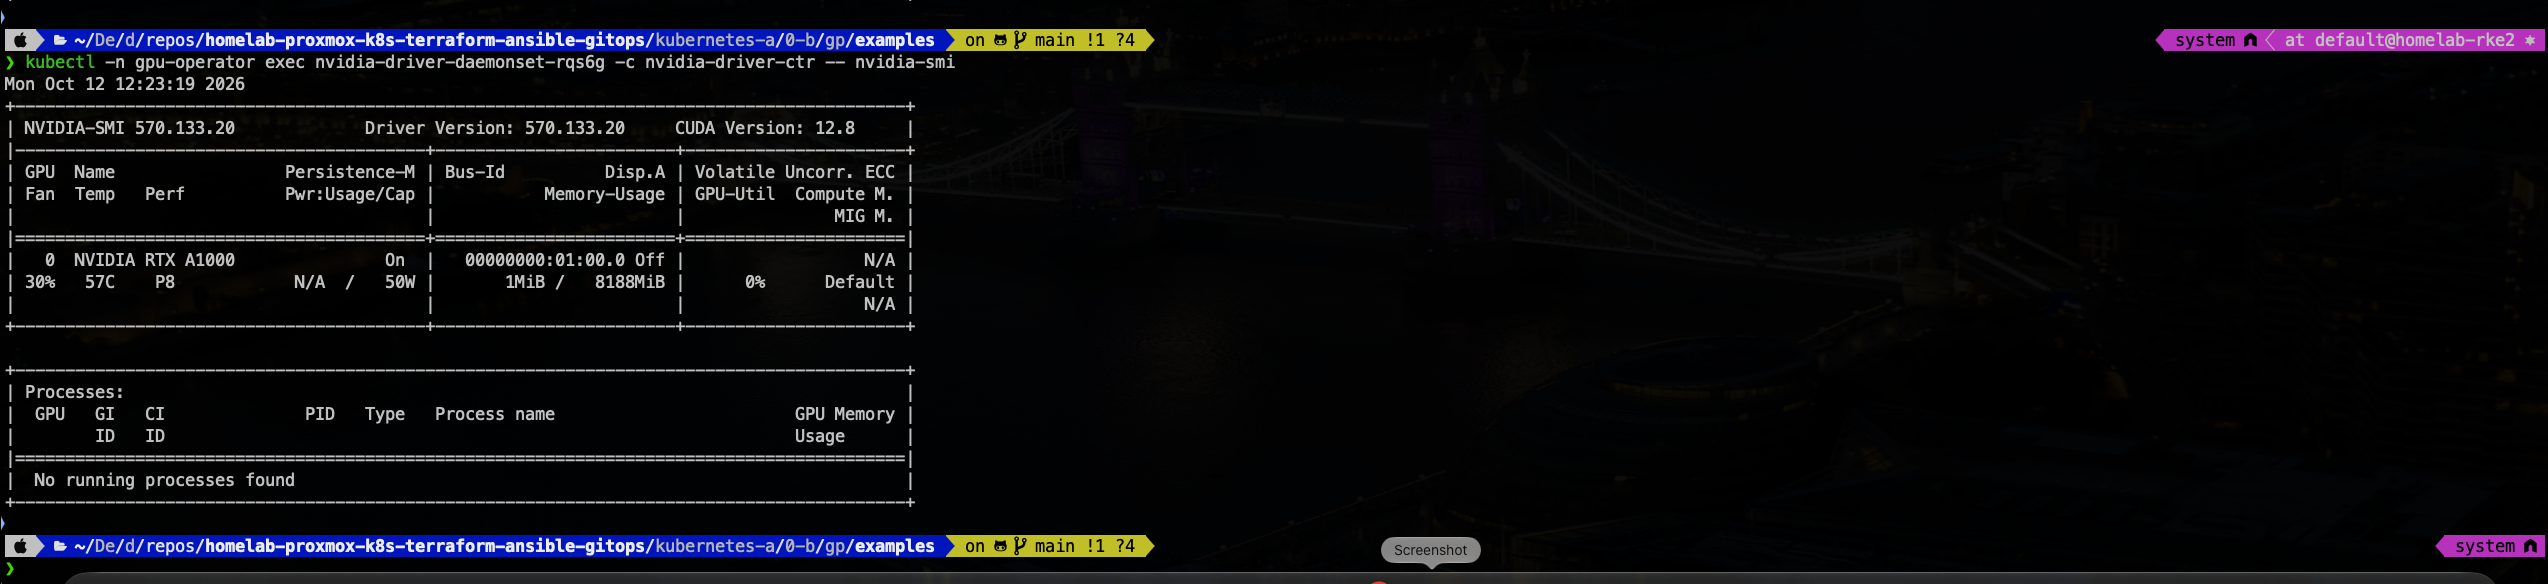
nvidia-smi side by side on the three GPU nodes, one per datacenter.
Introduction
Three GPUs. Three datacenters. Zero schedulable.
I had three NVIDIA cards in three machines, and Kubernetes swore I had none. I asked for one GPU in a test pod and got this:
0/21 nodes are available: 21 Insufficient nvidia.com/gpu.
The Proxmox hosts could see them. lspci could see them. nvidia-smi on the host lit up. But to the cluster, three cards' worth of Ampere silicon were parked, idle and invisible. That's the most expensive kind of idle there is.
And the whole MLOps platform from the earlier episodes (Kubeflow, Katib, KServe, the training pipelines) was built to train and serve real models. You can't schedule what the scheduler doesn't know exists.
Fitting the cards took a Saturday. Getting the kernel module, the container runtime, the device plugin and the scheduler to agree took a lot longer, and taught me thirteen different ways a GPU can hide from Kubernetes.
Here's where it ended up. Three RTX A1000s, one in each "datacenter", which here means one in each of three mini PCs on a shelf. Lose a whole machine and two cards are still there. The NVIDIA GPU Operator builds the driver, wires up the runtime and advertises the cards on its own.
And the part I'm proud of: when the whole lab loses power, all three cards come back and pass their CUDA self-test without me touching anything.
This is how I got there, every trap along the way, and the parts that still aren't done.
And at the end there's a real job on a real card: a 7-billion-parameter language model answering at about 30 tokens a second, against 4 on the CPU beside it.
Where this sits in the build
Foundation: Terraform on Proxmox.
Framing: Ansible building the five-master HA RKE2 cluster.
Security: Kyverno, KubeArmor and Trivy, with Falco parked for now to save CPU.
Workshop: Tekton, Harbor, SonarQube and Chains.
Storage floor: Rook-Ceph and CloudNativePG.
The safe: HA HashiCorp Vault.
The sports car: this one.

This is where the cluster stops being general-purpose Kubernetes and gains an accelerator pool. Before the operator went in, the three GPU workers were scheduled like any other node, by CPU and memory, with no idea a GPU was attached.
The repo side is small: one namespace, one chart, one values file, and one ClusterPolicy the operator builds everything from.
kubernetes-addons/0-boostrap/gpu-operator/
  namespace.yaml             # gpu-operator namespace, privileged Pod Security
  gpu-operator-values.yaml   # annotated Helm values; every trap fix lives here
  dcgm-custom-metrics.yaml   # extra DCGM fields for the dashboard
  nvidia-dcgm-dashboard.yaml # Grafana dashboard
  examples/                  # multi-GPU best-practice manifests
The hardware in the garage
The cards: three NVIDIA RTX A1000s. Ampere GA107GL, 8 GB of GDDR6, 2,304 CUDA cores, about 50 W. It draws all its power from the PCIe slot, with no extra connector, which is exactly why it fits where a bigger card wouldn't. The node label says it plainly:
$ kubectl get node rke2-worker-dc1-gpu-a \
    -o jsonpath='{.metadata.labels.nvidia\.com/gpu\.product} {.metadata.labels.nvidia\.com/gpu\.memory}MiB'
NVIDIA-RTX-A1000 8188MiB
The hosts: three Minisforum MS-01s. Intel i9-13900H, 96 GB of DDR5, and, rarely for a mini PC, one real half-height PCIe slot wired to the CPU: x16 in length, x8 electrically, which is plenty for this card. That slot is the whole reason this build exists.
| Datacenter | Proxmox host | GPU worker | GPU | VRAM |
|---|---|---|---|---|
| dc1 | proxmox-dc-1 | rke2-worker-dc1-gpu-a | RTX A1000 | 8 GB |
| dc2 | proxmox-dc-2 | rke2-worker-dc2-gpu-a | RTX A1000 | 8 GB |
| dc3 | proxmox-dc-3 | rke2-worker-dc3-gpu-a | RTX A1000 | 8 GB |
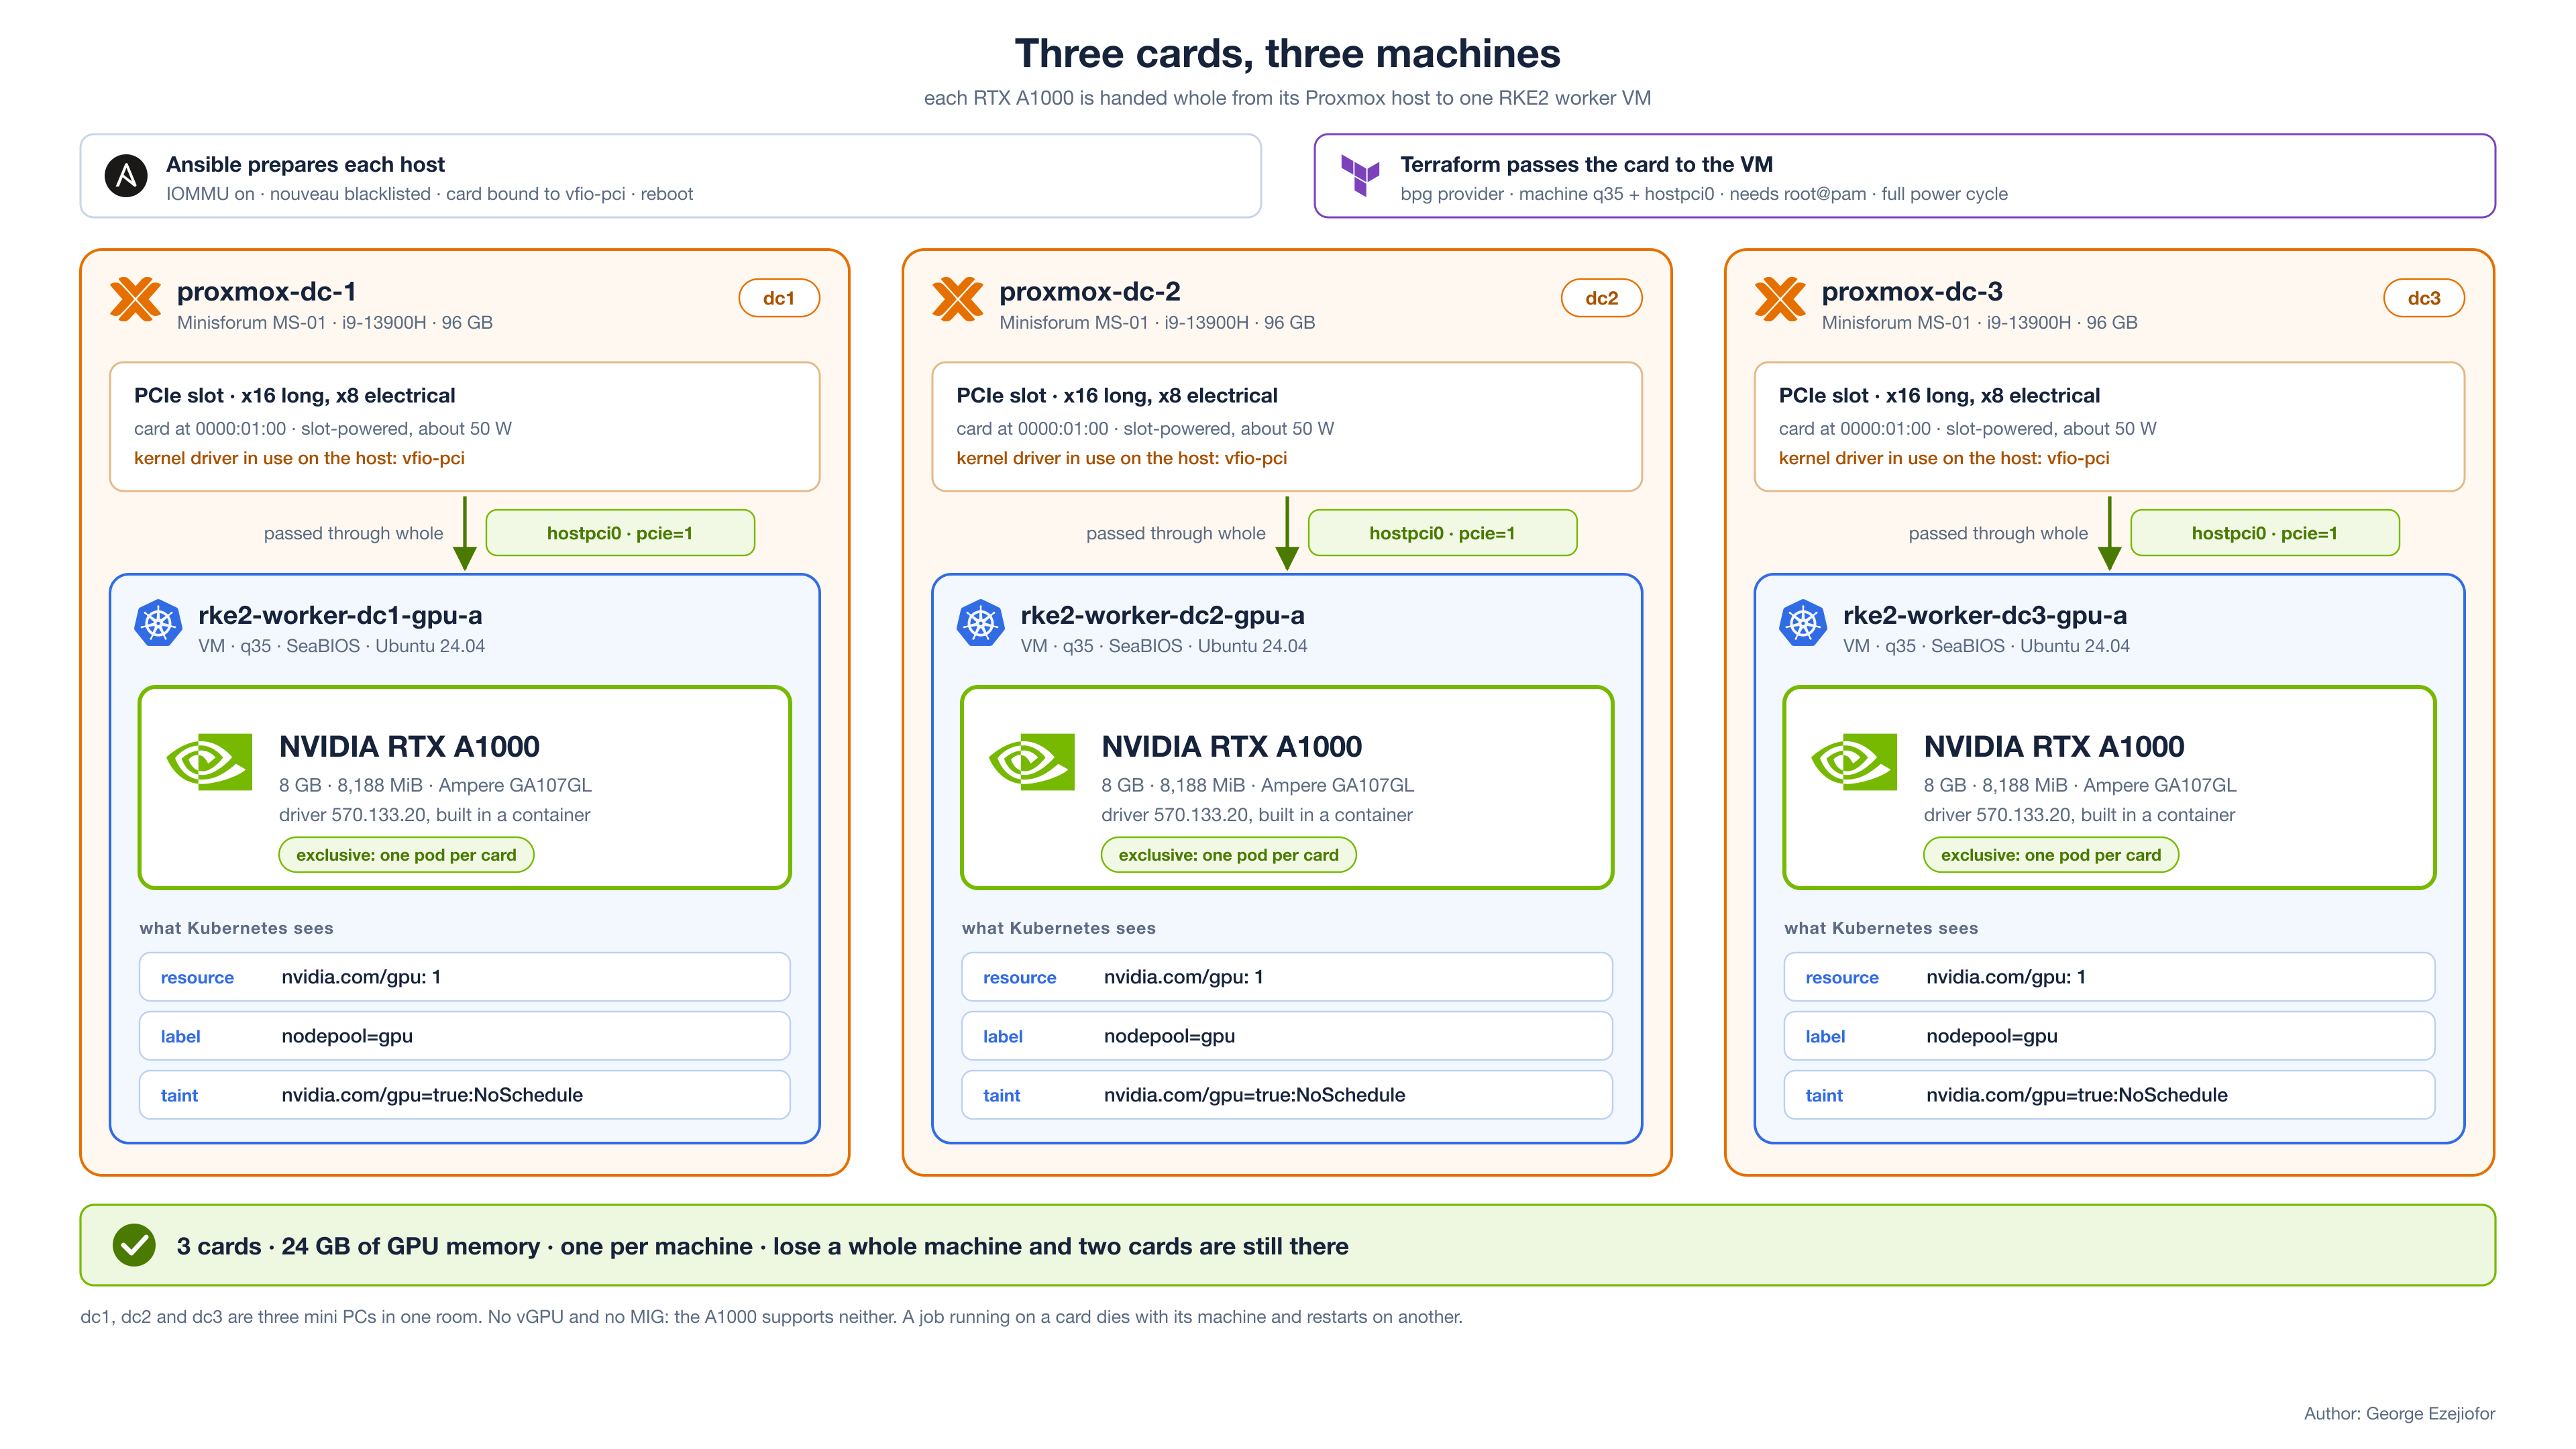
Three cards, three machines: PCIe passthrough from Proxmox host to RKE2 worker.
That's 24 GB of GPU memory across the fleet. One 8 GB card runs a 4-bit 7B model with room to spare; I measure that further down. It's great for inference, fine for small fine-tunes, and marginal for training from scratch, which is a rented-A100 job anyway.
Why one card per datacenter instead of three in one box? The same answer as storage: failure domains. If a machine goes down, GPU work still has two healthy places to land. In a homelab, rack density is worth nothing and HA is worth a lot.
Why bother with Kubernetes when the GPU is right there on the host? Three reasons. Each project gets its CUDA version from an image tag instead of eight CUDA installs fighting each other. The runtime becomes a pinned image, so results are reproducible. And the scheduler is the only sane way to say "this job gets one card, that one gets another".
PCIe passthrough: from Proxmox to the VM
Each card is bound to vfio-pci on its Proxmox host and passed into exactly one VM. An Ansible playbook handles the nouveau blacklist, the vfio binding, IOMMU and the reboot. All three cards sit at the same address, 0000:01:00, which keeps the Terraform pleasingly uniform.
The passthrough itself is Terraform with the bpg provider, through a gpu_pci_hosts map per datacenter. One gotcha deserves its own sentence: raw hostpci needs the root@pam Proxmox user. A normal API token can't assign raw PCI devices, and the error doesn't tell you that.
cd terraform/environment/prod-rke2/bpg
terraform plan  -target=module.rke2_worker_dc2_gpu -target=module.rke2_worker_dc3_gpu
# 0 to add, 2 to change, 0 to destroy   (in place: +machine=q35, +hostpci0)
terraform apply -target=module.rke2_worker_dc2_gpu -target=module.rke2_worker_dc3_gpu
machine=q35 and hostpci0 only take effect after a full power cycle of the VM, not a soft reboot.
The best moment of the whole build came here. Once dc1 worked, I passed the cards through on dc2 and dc3 and rebooted them. The card appeared, the node got labelled, and the operator rolled the entire stack onto both nodes by itself. The first node took me twelve hours. The other two took about ninety seconds each, and I didn't touch them.
Three hardware notes that earned their place:
Driver version is pinned to
570.133.20. The version stays put. What has to follow the kernel is the module, which the driver container rebuilds against whatever kernel the VM is running.No vGPU, no MIG. The A1000 supports neither.
Secure Boot never gets a say. The GPU VMs boot with SeaBIOS, not UEFI, so the unsigned NVIDIA module loads without any key enrolment. The Proxmox hosts themselves do have Secure Boot on; it doesn't matter, because the module loads inside the VM. If your VMs use UEFI with Secure Boot, you'll have to sign the module or switch it off there.
What the GPU Operator actually does
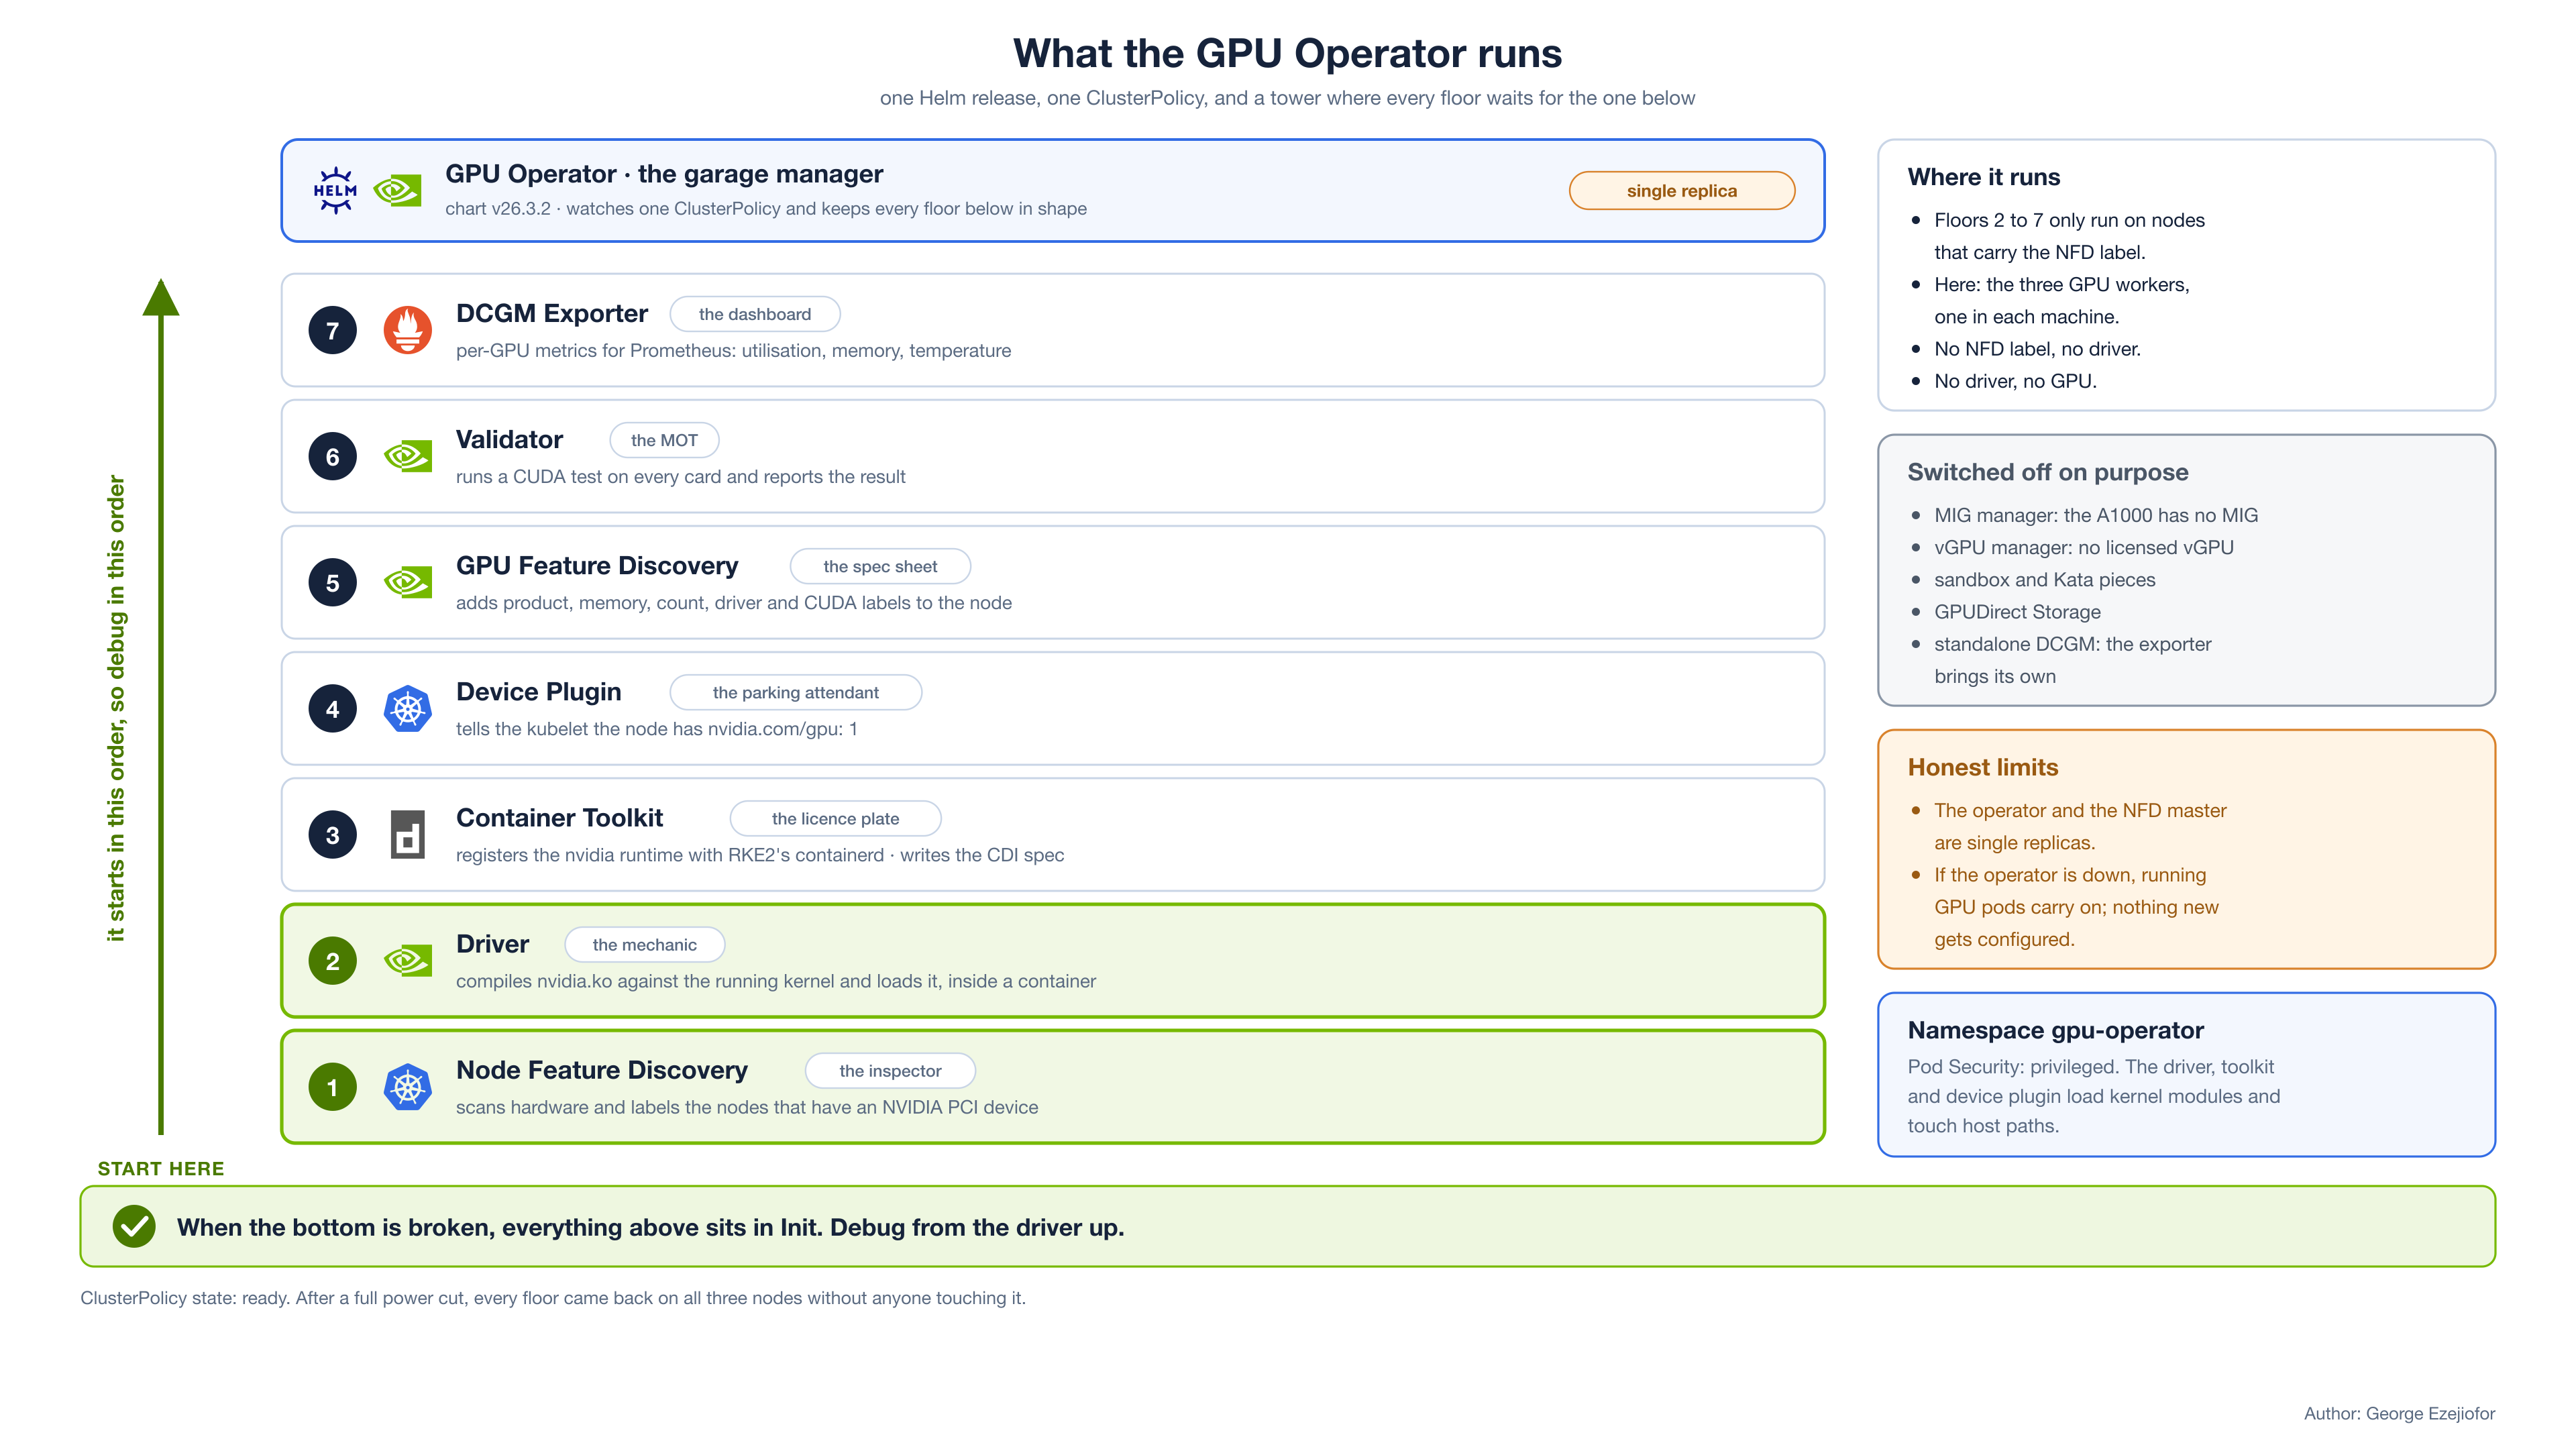
What the GPU Operator runs: a tower where every floor waits for the one below.
One Helm release of nvidia/gpu-operator (chart v26.3.2) runs a set of DaemonSets from a single ClusterPolicy. Sticking with the garage:
| Component | In plain terms | What it really does |
|---|---|---|
| Operator | the garage manager | watches the ClusterPolicy and keeps everything below in shape |
| NFD (Node Feature Discovery) | the inspector | scans hardware and labels nodes that have an NVIDIA PCI device |
| GFD (GPU Feature Discovery) | the spec sheet | adds product, memory, count, driver and CUDA labels |
| Driver | the mechanic | compiles and loads nvidia.ko against the running kernel, inside a container |
| Container Toolkit | the licence plate | registers the nvidia runtime with containerd |
| Device Plugin | the parking attendant | advertises nvidia.com/gpu to the kubelet |
| DCGM Exporter | the dashboard | per-GPU metrics for Prometheus |
| Validator | the MOT | runs a CUDA test on every card and reports the result |
The dependency chain is the thing to remember. NFD (Node Feature Discovery) labels the nodes that have a GPU. Everything else only runs where that label is. So the driver, toolkit and device plugin land on the three GPU workers and nowhere else. No NFD label, no driver. No driver, no GPU.
And every other piece waits for the driver. When the bottom of that tower is broken, everything above it sits in Init. That gave me the rule that saved the most time: debug from the driver up. There's no point staring at the device plugin while the driver is still crash-looping.
What I deliberately don't run: the MIG manager (the A1000 has no MIG), the vGPU manager (that's for licensed shared vGPU), the sandbox and Kata pieces (the card is passed through once, at Proxmox), GPUDirect Storage (no hardware for it), and a standalone DCGM (the exporter brings its own, and two would fight over one socket).
The stack lives in the gpu-operator namespace with privileged Pod Security. The driver, toolkit and device plugin load kernel modules and touch host paths, and a restricted namespace blocks every one of them.
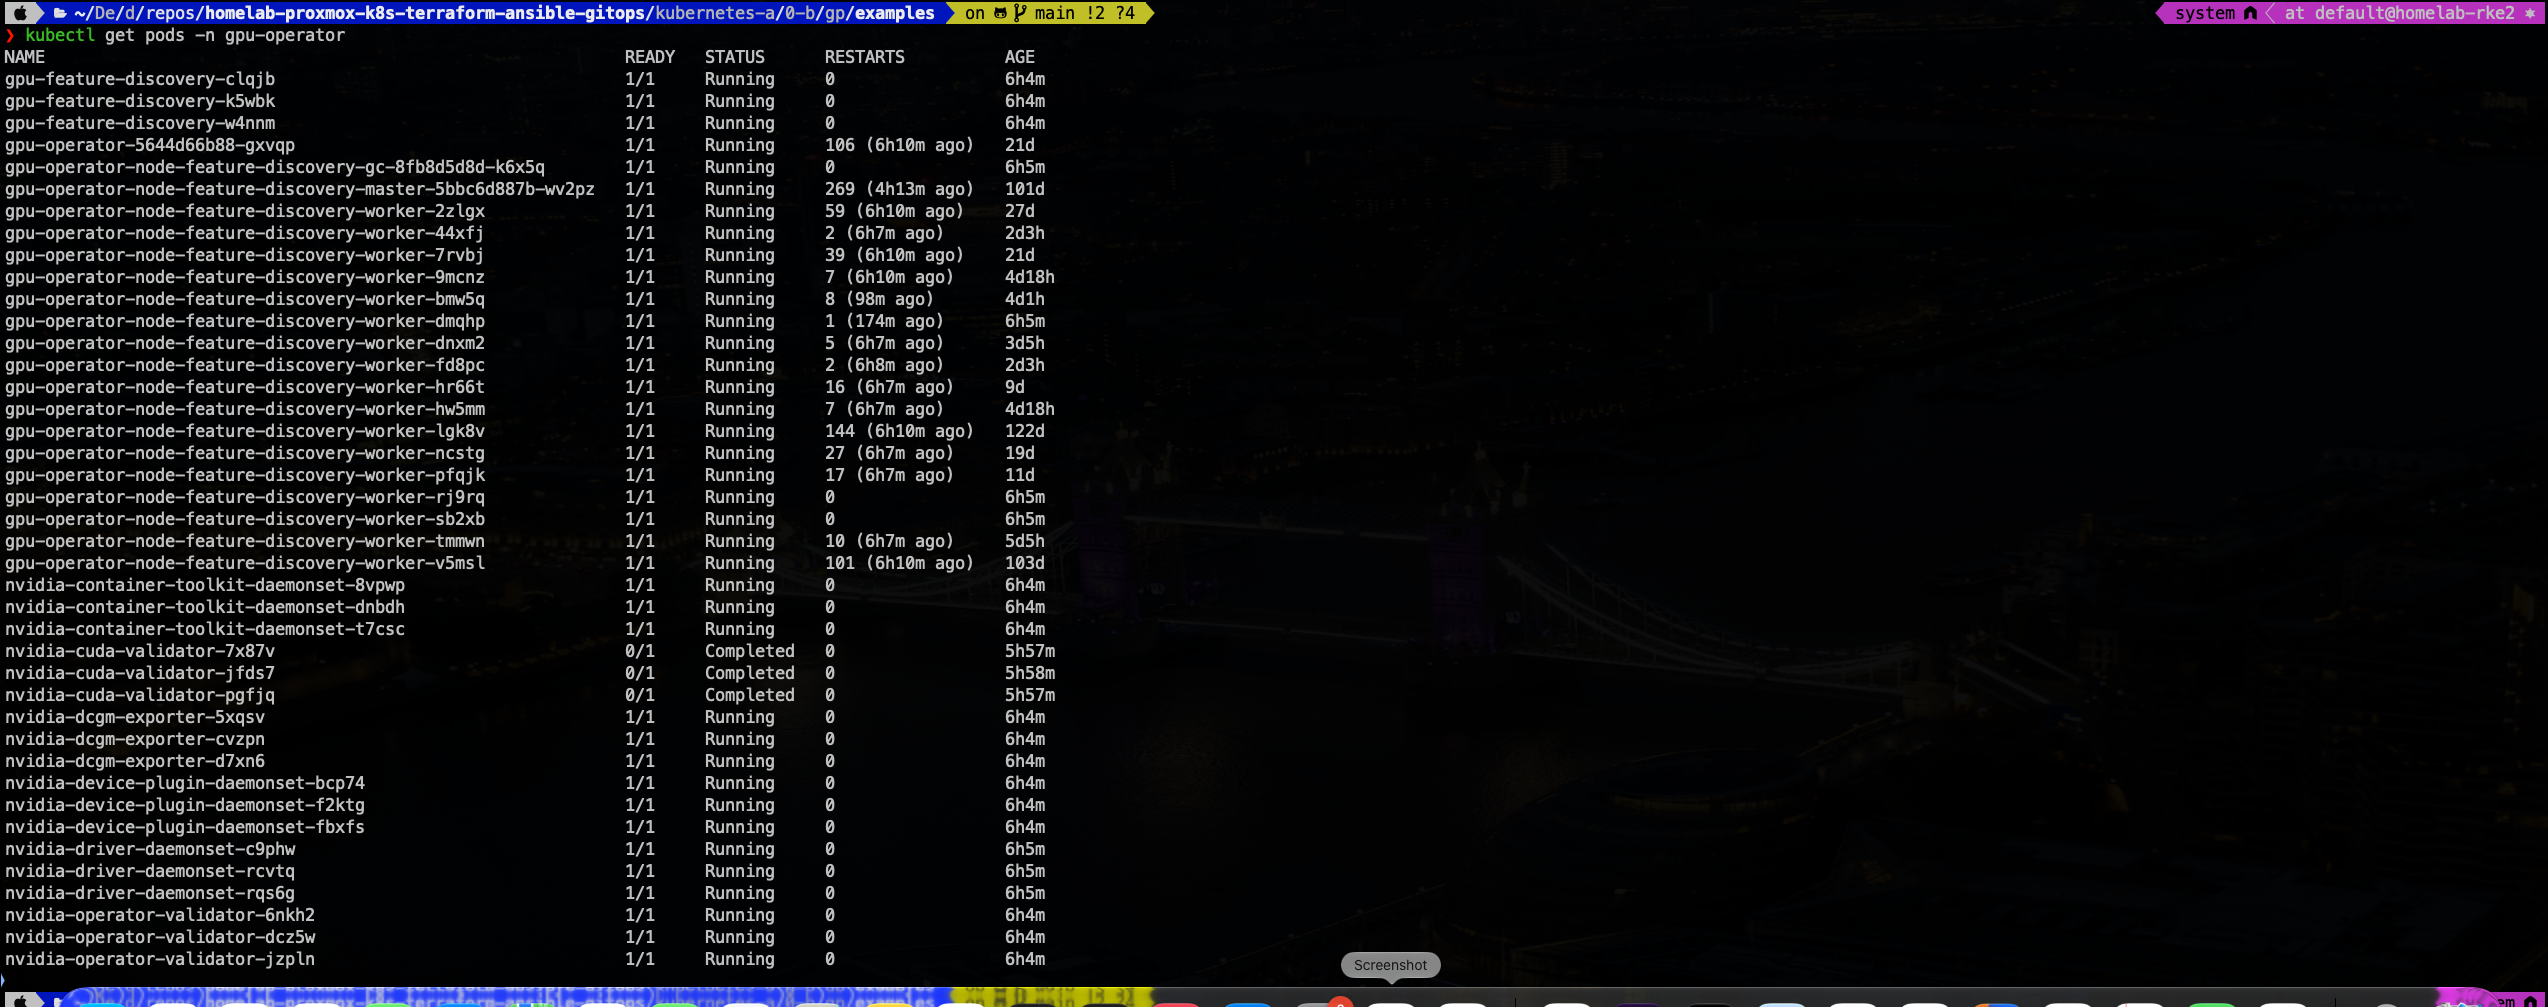
kubectl get pods -n gpu-operator mid-cascade: a wall of Init:0/1 and one very sad nvidia-driver-daemonset. The "before" shot.
From PCIe slot to scheduled pod
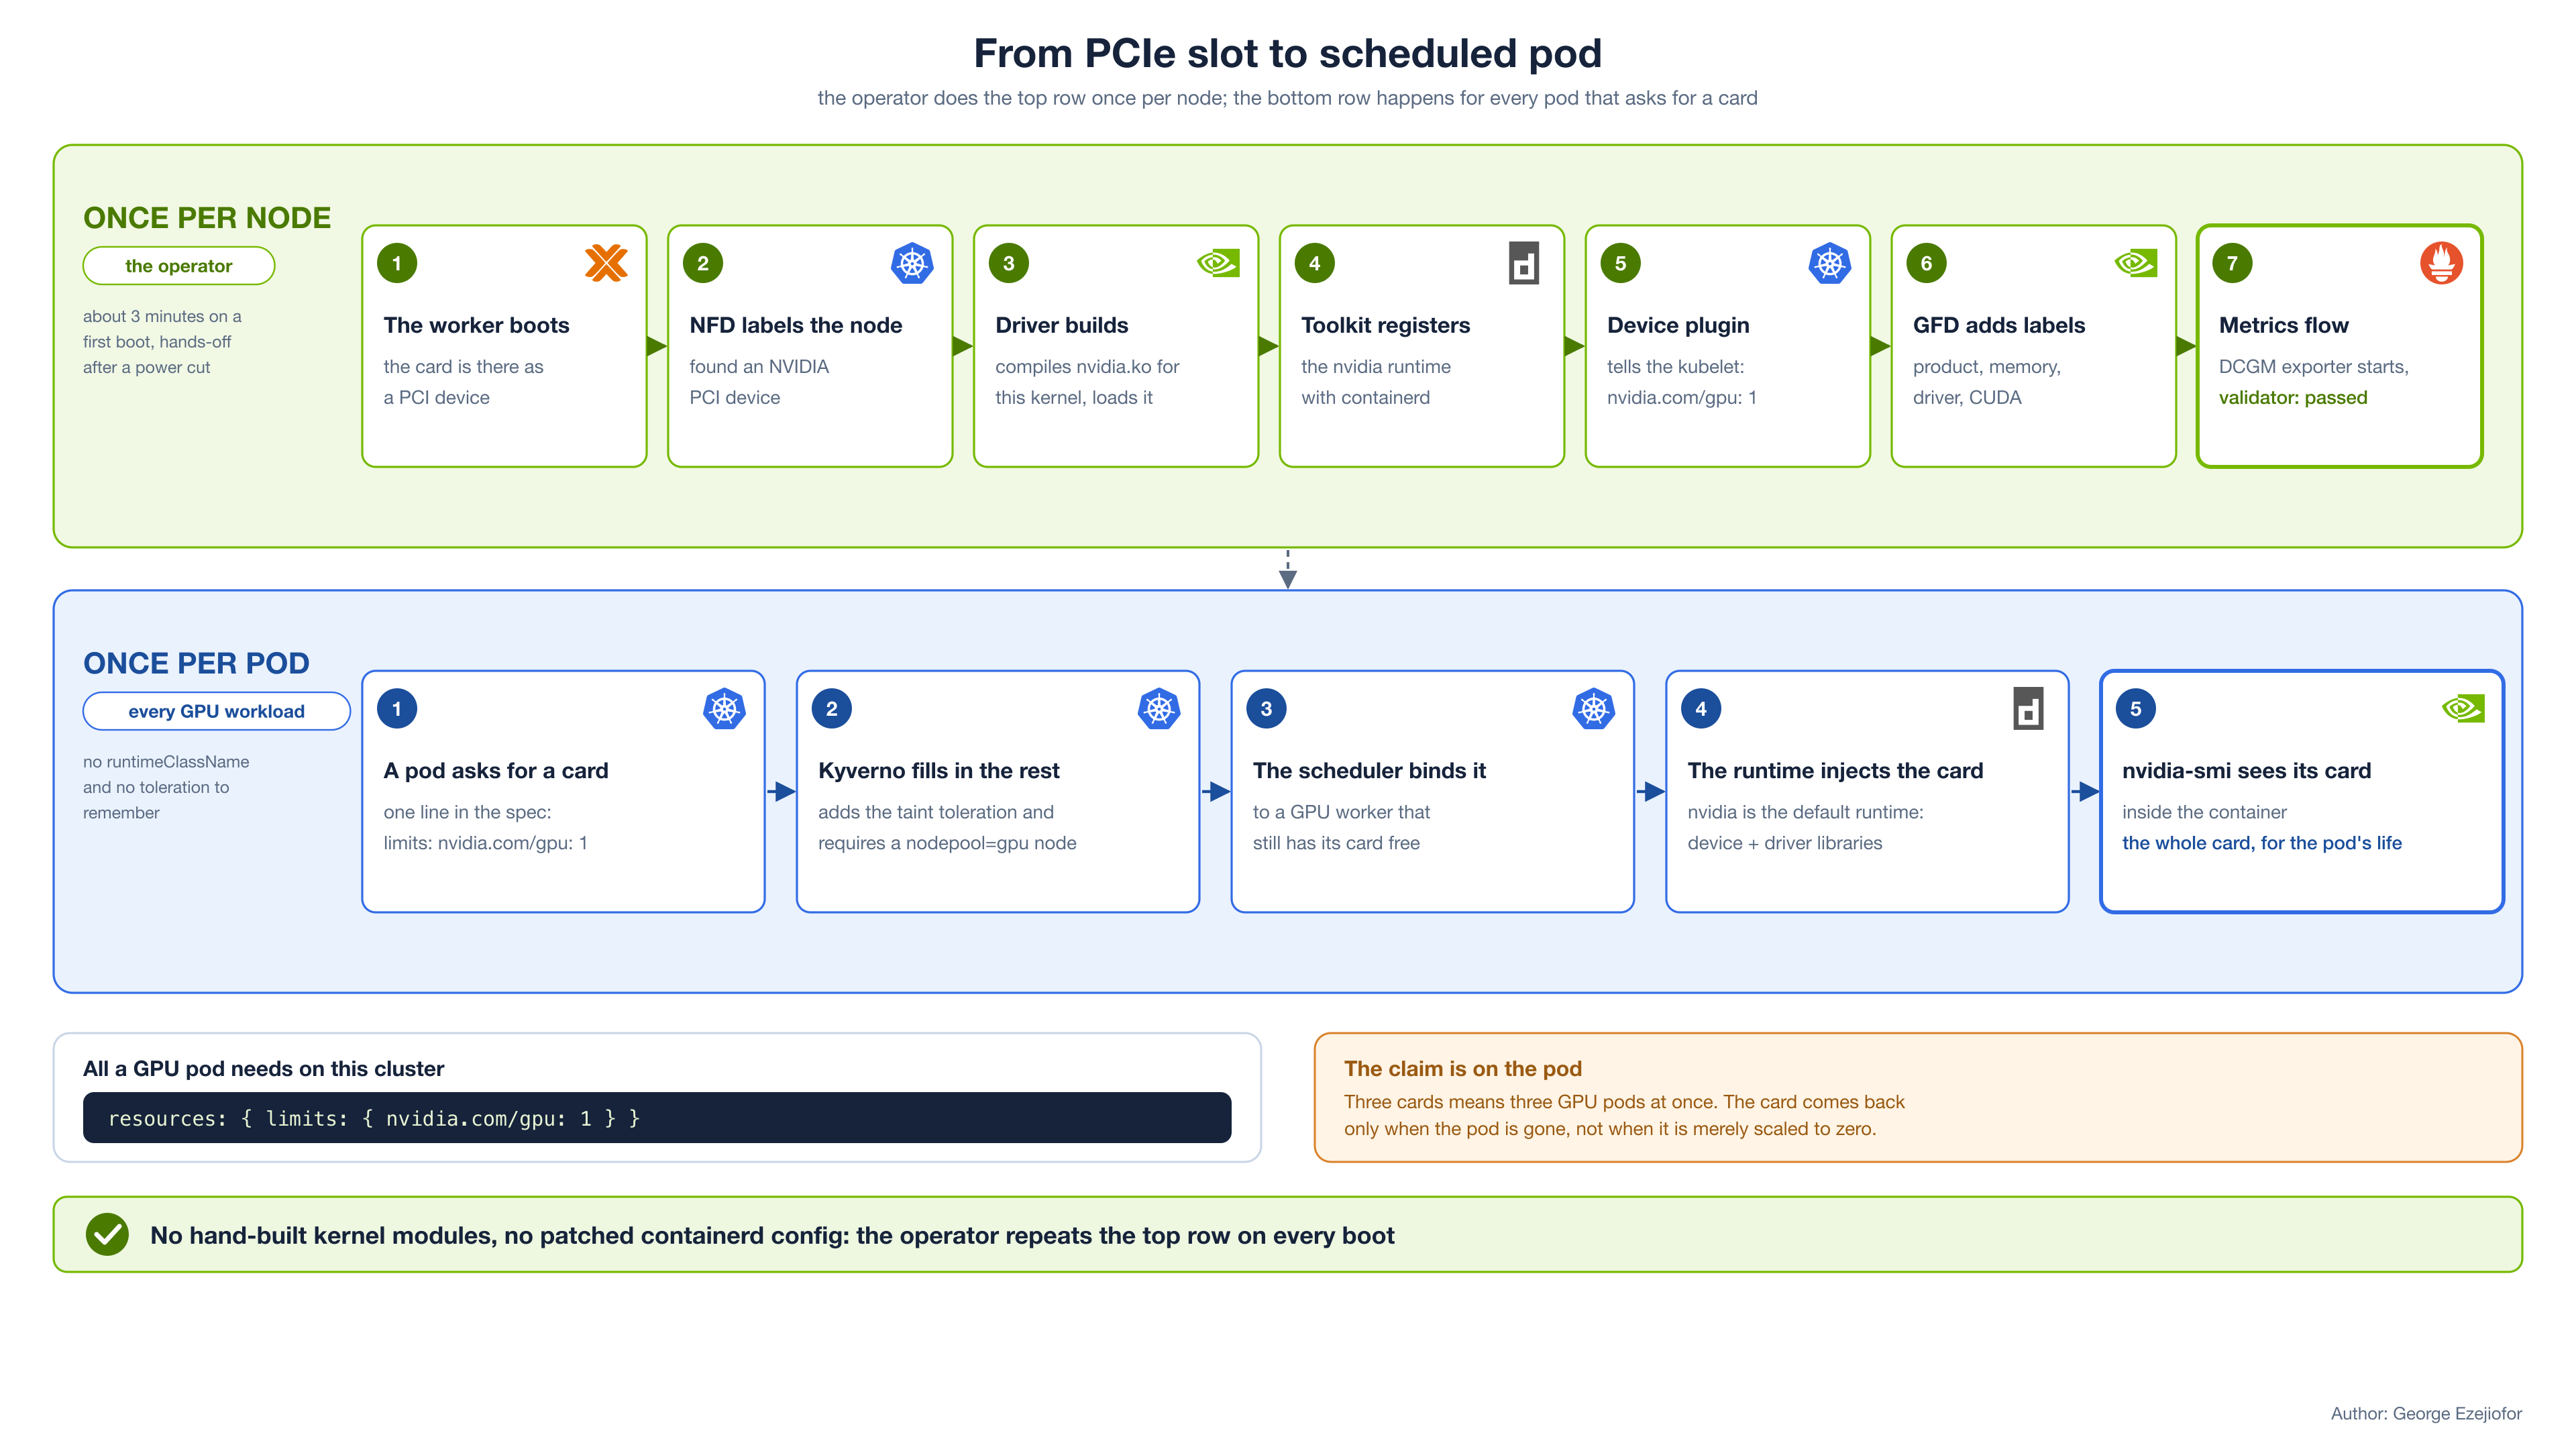
From PCIe slot to scheduled pod: once per node, then once per pod.
Once per node:
The worker boots with the GPU present as a PCI device.
NFD (Node Feature Discovery) labels the node.
The driver pod compiles
nvidia.kofor the running kernel and loads it.The toolkit registers the
nvidiaruntime with containerd.The device plugin tells the kubelet the node has
nvidia.com/gpu: 1.GFD adds
nvidia.com/gpu.product=NVIDIA-RTX-A1000and friends.The DCGM exporter starts and metrics flow.
Then once per pod:
A workload asks for
nvidia.com/gpu: 1.Kyverno adds the taint toleration and the GPU node rule (more on that in the next section).
The scheduler finds a GPU node with a free card and binds the pod.
The NVIDIA runtime injects the device and driver libraries.
nvidia-smiinside the container sees its card.
All of it is automatic once the operator is in. That's the whole argument against a hand-rolled Ansible role that builds kernel modules per node and breaks on every kernel upgrade.
Keeping GPU pods on GPU nodes
Two bits of metadata mark these nodes, and you want both:
A label so workloads can find them:
nodepool=gpu, plus everything NFD and GFD add.A taint so ordinary workloads can't drift onto them and starve a GPU job:
nvidia.com/gpu=true:NoSchedule.
$ kubectl get node rke2-worker-dc1-gpu-a -o jsonpath='{.spec.taints}'
[{"effect":"NoSchedule","key":"nvidia.com/gpu","value":"true"}]
Normally that means every GPU pod needs a toleration, a node selector and a resource limit, and forgetting any one gives you a confusing failure. On this cluster a Kyverno policy, gpu-pods-to-gpu-nodes, does the first two for you. Any pod that asks for nvidia.com/gpu is mutated to tolerate the taint and require a nodepool=gpu node. So a GPU pod here needs exactly one line:
resources:
  limits:
    nvidia.com/gpu: 1
The operator's own DaemonSets carry the toleration in the values file, and NFD's master also needs a control-plane toleration:
daemonsets:
  priorityClassName: system-node-critical
  tolerations:
    - key: nvidia.com/gpu
      operator: Exists
      effect: NoSchedule

nfd:
  master:
    tolerations:
      - key: node-role.kubernetes.io/control-plane
        operator: Equal
        value: ""
        effect: NoSchedule
Prove it works
The quickest proof is NVIDIA's own CUDA sample. It adds two vectors on the card and prints one line if the whole chain held: driver, runtime, device plugin, scheduler.
apiVersion: v1
kind: Pod
metadata:
  name: cuda-vectoradd
  namespace: default
spec:
  restartPolicy: OnFailure
  securityContext:
    runAsNonRoot: true
    runAsUser: 1000
    seccompProfile:
      type: RuntimeDefault
  containers:
    - name: cuda-vectoradd
      image: nvcr.io/nvidia/k8s/cuda-sample:vectoradd-cuda12.5.0-ubuntu22.04
      securityContext:
        allowPrivilegeEscalation: false
        capabilities:
          drop:
            - ALL
      resources:
        limits:
          nvidia.com/gpu: 1
Look at what isn't there: no toleration, no node selector, no runtimeClassName. The only GPU line is the limit. The securityContext blocks have nothing to do with the GPU; my default namespace enforces the restricted Pod Security Standard, so every pod there needs them.
$ kubectl apply -f cuda-vectoradd.yaml
$ kubectl get pod cuda-vectoradd -o wide
NAME             READY   STATUS      RESTARTS   AGE   NODE
cuda-vectoradd   0/1     Completed   0          16s   rke2-worker-dc1-gpu-a

$ kubectl logs cuda-vectoradd
[Vector addition of 50000 elements]
Copy input data from the host memory to the CUDA device
CUDA kernel launch with 196 blocks of 256 threads
Copy output data from the CUDA device to the host memory
Test PASSED
Done
Sixteen seconds from apply to Completed, image pull included. The pod landed on a GPU worker without being told to, and you can see what Kyverno wrote into it on the way in:
$ kubectl get pod cuda-vectoradd -o jsonpath='{.spec.tolerations}'
[{"effect":"NoSchedule","key":"nvidia.com/gpu","operator":"Equal","value":"true"}]

$ kubectl get pod cuda-vectoradd -o jsonpath='{.spec.affinity.nodeAffinity}'
{"requiredDuringSchedulingIgnoredDuringExecution":{"nodeSelectorTerms":[{"matchExpressions":[{"key":"nodepool","operator":"In","values":["gpu"]}]}]}}
Delete the pod when you're done. It has finished, so it isn't holding the card, but it's clutter.
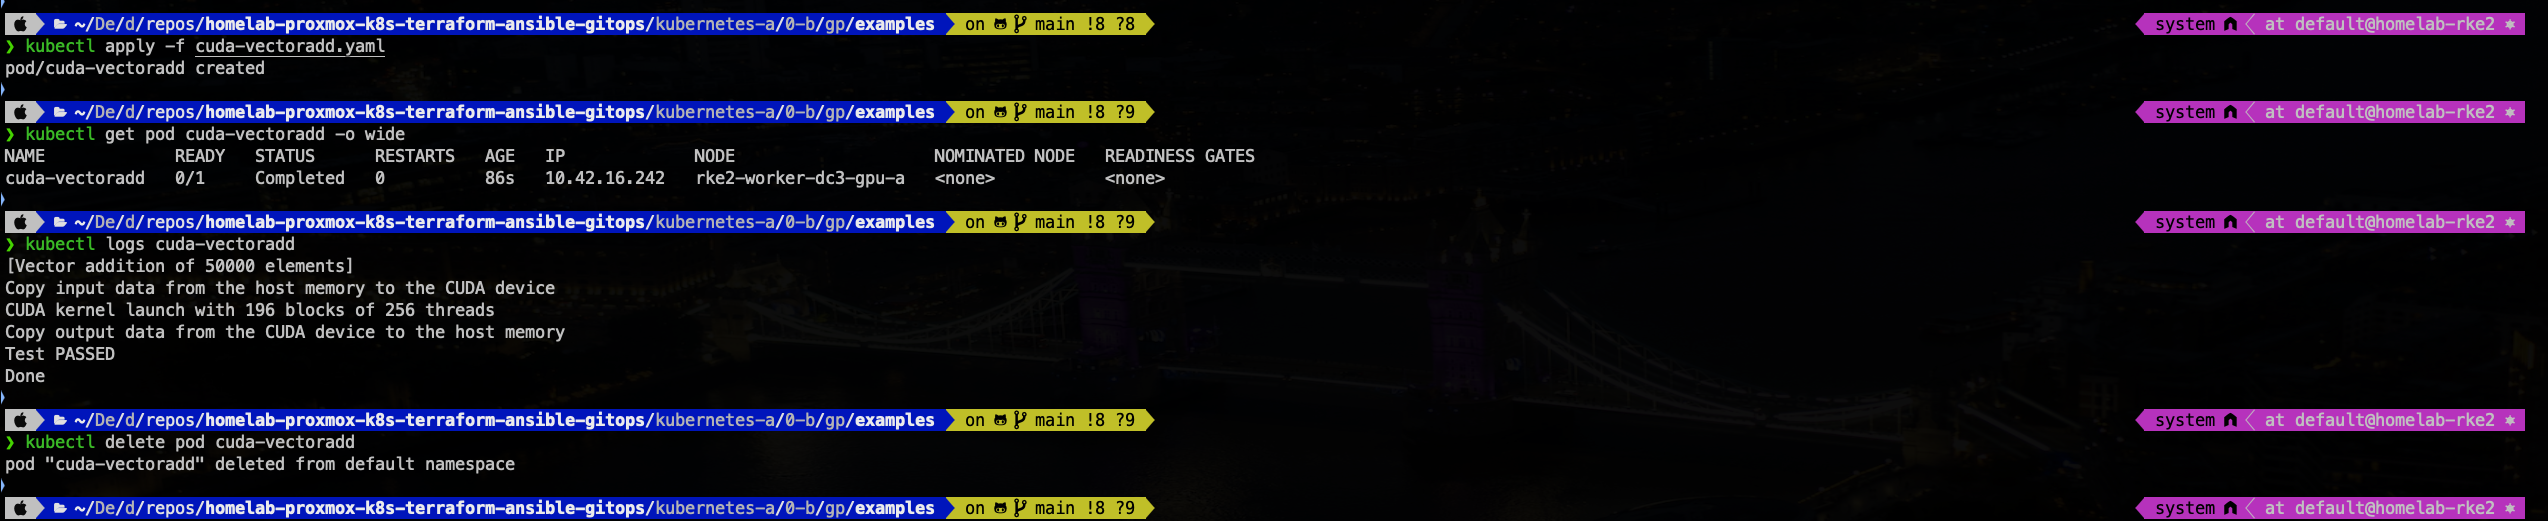
kubectl logs cuda-vectoradd ending in Test PASSED. The hero shot.
The runtime: getting containerd to know about GPUs
containerd doesn't know what a GPU is. Something has to register an nvidia runtime that injects the device and driver libraries into containers. The classic way is to patch containerd's config.toml, and RKE2 regenerates that file from a template, throwing your patch away on every restart.
Two things make it work here. CDI is on, so the toolkit writes a device spec at /etc/cdi/nvidia.yaml that containerd reads at container start:
cdi:
  enabled: true
  nriPluginEnabled: false
And the toolkit is pointed at RKE2's own containerd rather than the default one:
toolkit:
  env:
    - name: CONTAINERD_CONFIG
      value: /var/lib/rancher/rke2/agent/etc/containerd/config.toml
    - name: CONTAINERD_SOCKET
      value: /run/k3s/containerd/containerd.sock
    - name: CONTAINERD_RUNTIME_CLASS
      value: nvidia
    - name: CONTAINERD_SET_AS_DEFAULT
      value: "true"
The subtle bit is that CONTAINERD_CONFIG points at the generated config.toml, not the .tmpl. The toolkit re-applies its setup every time it starts, so when a reboot regenerates the config without nvidia, the toolkit simply puts it back. That's what makes it heal itself across reboots. Point it at the template and the live config sits there without a GPU runtime until someone restarts rke2-agent by hand.
Because nvidia is the default runtime, workloads here don't need runtimeClassName: nvidia. On a cluster without that setting they do, and that one line is what confuses people copying manifests between clusters.
Sharing the cards
Each A1000 advertises exactly one nvidia.com/gpu, so by default one pod owns the whole card.
| Mode | What it does | Isolation | Here |
|---|---|---|---|
| Exclusive | one pod owns the card | full | ✅ what runs today |
| Time-slicing | several pods take turns on the card | compute only, memory is shared | available, not switched on |
| MIG | hardware partitions with their own memory | full | ❌ the A1000 has no MIG |
| MPS | processes share one GPU context | partial | available, not used |
The node labels confirm it: nvidia.com/gpu.replicas=1 and sharing-strategy=none on all three.
Time-slicing is a ConfigMap plus a patch to the ClusterPolicy:
apiVersion: v1
kind: ConfigMap
metadata:
  name: time-slicing-config
  namespace: gpu-operator
data:
  a1000: |-
    version: v1
    sharing:
      timeSlicing:
        resources:
          - name: nvidia.com/gpu
            replicas: 4        # one A1000 looks like four schedulable GPUs
kubectl patch clusterpolicies.nvidia.com cluster-policy --type merge \
  -p '{"spec":{"devicePlugin":{"config":{"name":"time-slicing-config","default":"a1000"}}}}'
Create the ConfigMap first, then patch. I ran the patch on its own once, and the device plugin's replacement pod sat in Init with configmap "time-slicing-config" not found, which took that node's card from one schedulable GPU to zero until I cleared the reference again. The DaemonSet replaces one pod at a time, so the rollout stalled there and the other two cards kept working.
Before you turn it on, remember it's oversubscription, not partitioning:
No memory isolation. Four pods share 8 GB. Four 2 GB models fit; a fourth 3 GB model dies with CUDA out-of-memory.
No fault isolation. One pod that wedges the card affects its neighbours.
Sharing, not guarantees. Right for notebooks and bursty inference, wrong for anything with a latency target.
My plan is to time-slice dc1 and dc2 and leave dc3 whole for jobs that need all 8 GB.
How reliable is it?
Here's what the GPU tier survives, and the evidence for each:
| What goes wrong | What happens | How I know |
|---|---|---|
| A whole machine goes down | Its card is gone, and so is any job that was running on it; new GPU pods land on the other two | One card per machine (dc1, dc2, dc3), each advertising nvidia.com/gpu: 1 |
| The whole lab loses power | Every node rebuilds its GPU stack and re-tests its card, hands-off | After the last power cut, the toolkit, device plugin, DCGM exporter and validators came back on all three nodes by themselves, and the CUDA validator Succeeded on every card |
| RKE2 regenerates containerd's config on reboot | The toolkit re-applies the nvidia runtime |
CONTAINERD_CONFIG points at the generated file, not the template |
| Someone forgets the GPU toleration | Kyverno adds it, plus the GPU node affinity | gpu-pods-to-gpu-nodes mutation policy |
| A notebook is abandoned with a card | It should be stopped after 24 hours idle and the card freed | Config only: ENABLE_CULLING=true, CULL_IDLE_TIME=1440. I have not seen it fire. The lab is powered off overnight, and two notebooks sat on cards until I stopped them by hand |
| A driver or runtime problem | The operator stops and reports it | ClusterPolicy state ready; validators gate everything above the driver |
And the honest limits. "Highly available" here means GPU capacity: a job running on a card dies with its machine and has to start again elsewhere. The operator itself is a single replica; if it's down, running GPU pods carry on and nothing new gets configured. A kernel upgrade on a GPU node still needs a driver rebuild (see the traps), there are no GPU alerts wired yet, and nothing caps how many cards one namespace can take. Those last three are on the list at the end.

kubectl get pods -n gpu-operator -l app=nvidia-cuda-validator: three validators, one per datacenter, all Completed.
The traps, from the driver up
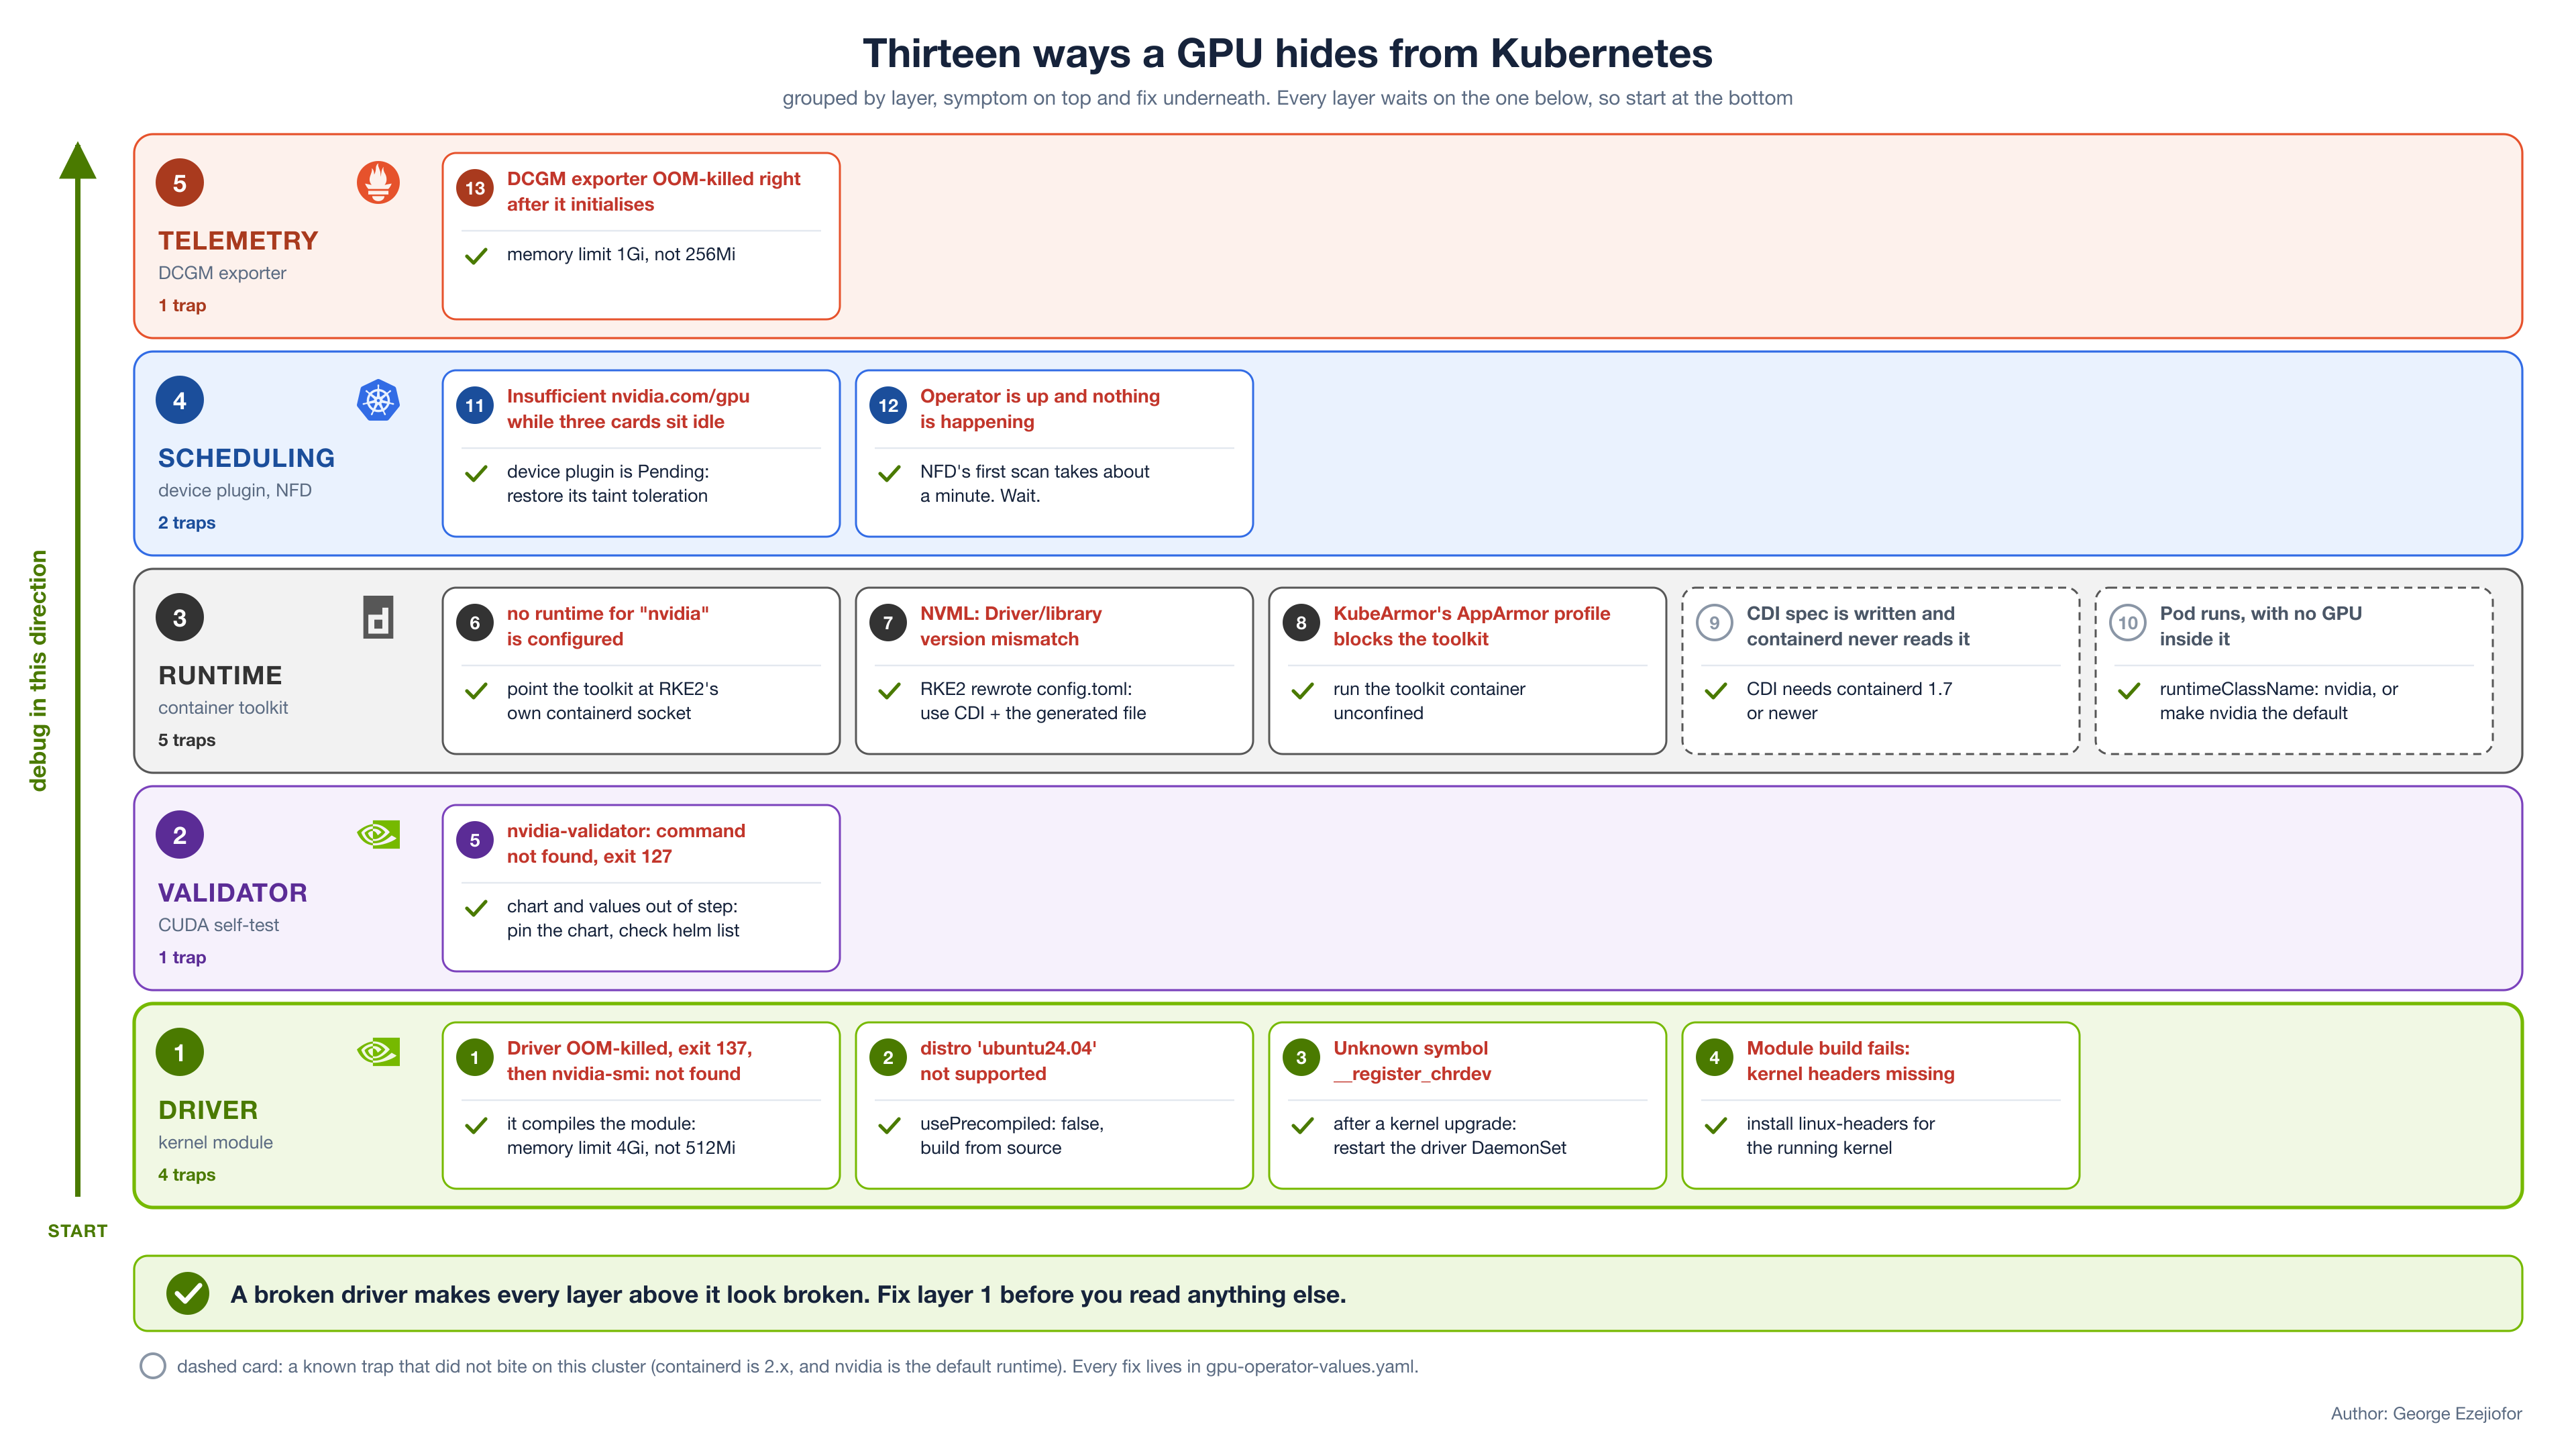
Thirteen ways a GPU hides from Kubernetes, by layer, from the driver up.
Thirteen of them, grouped by layer, in the order you should debug them. Most of them bit me. A few I only know from other people's write-ups, and those say so. Every piece waits on the driver, so a broken foundation makes everything above it look broken too.
The driver
The driver gets OOM-killed, exit 137. The log dies right after an nvidia-drm warning, then nvidia-smi: not found, and it crash-loops. It looks like a driver bug. It isn't: the driver container compiles the kernel module, running gcc against the kernel headers, and a 512Mi limit kills it mid-compile.
driver:
  resources:
    limits:
      cpu: "2"
      memory: 4Gi     # 512Mi OOMs the kernel-module compile
failed to install nvidia kernel module: distro 'ubuntu24.04' not supported. The driver image ships pre-built modules for a fixed list of distro and kernel pairs, and mine wasn't on it. Build from source instead:
driver:
  kernelModuleType: auto      # open modules first, proprietary as fallback
  usePrecompiled: false       # build from source, about 3 minutes on first boot
nvidia: Unknown symbol __register_chrdev after a host kernel upgrade. The cached module was built for the old kernel. Force a rebuild:
kubectl -n gpu-operator rollout restart daemonset/nvidia-driver-daemonset
The real lesson is a runbook entry, not a config change: a GPU node's kernel upgrade is a special operation, with a driver restart on the checklist. A plain power cut doesn't need it, because the kernel hasn't changed.
Missing kernel headers. The driver builds against the running kernel, so a kernel upgraded without linux-headers-$(uname -r) fails the build. The Ansible role for the GPU pool installs them, and the error is plain in the driver pod log.
The validator
nvidia-validator: command not found, exit 127. Version skew, and the error tells you nothing. Older charts shipped the validator as a separate image; the 26.x chart puts the binary inside the main operator image. Values written for one layout against a chart of the other produce a missing binary. Pin the chart (v26.3.2 here), deploy it from the NVIDIA repo rather than a stale vendored copy, and check what's actually running with helm list -n gpu-operator, not what your values file assumes.
The toolkit and runtime
no runtime for "nvidia" is configured. The RKE2 trap the generic docs miss. The toolkit looks for /run/containerd/containerd.sock; RKE2 runs its own containerd at /run/k3s/containerd/containerd.sock. The fix is the toolkit.env block above.
Failed to initialize NVML: Driver/library version mismatch inside a pod, while the host shows the same version. The toolkit had patched config.toml directly and RKE2 regenerated it. CDI or the generated-config setting fixes it.
KubeArmor's AppArmor profile blocks the toolkit. The same family of trap that once bit Cilium here: the toolkit can't write what it needs, containerd is silently never configured, and pods report the nvidia RuntimeClass as missing. If you hit it, run the toolkit container unconfined. Today it runs fine under its own KubeArmor-generated profile.
The toolkit writes the CDI spec and containerd never reads it. Pods schedule, but nvidia-smi hangs. CDI needs containerd 1.7 or newer, so check what your RKE2 release ships before you switch it on. I didn't hit this one: my containerd is 2.x.
Missing runtimeClassName: nvidia on a cluster where nvidia isn't the default runtime. The pod schedules, runs with no GPU injected, and looks exactly like broken hardware. Not an issue here because of CONTAINERD_SET_AS_DEFAULT, which is why it's worth knowing: the requirement depends on the cluster.
The device plugin and scheduling
Insufficient nvidia.com/gpu while three healthy GPUs sit idle. The driver and toolkit were running, but the device plugin was Pending:
0/21 nodes are available: 21 node(s) had untolerated taint
{nvidia.com/gpu: true}, that the pod didn't tolerate.
No device-plugin pod means nothing tells the kubelet about the card. The upstream chart ships the right toleration, but a trimmed values file copied from a blog about an untainted cluster quietly drops it. Same trap one layer down: NFD's master without its control-plane toleration never labels anything, so nothing else schedules either.
NFD takes a minute on first install. The operator comes up before NFD's first scan, so for about a minute it looks like the operator is running and nothing is happening. It isn't broken. Don't start changing things.
Telemetry
The DCGM exporter gets OOM-killed right after logging DCGM successfully initialized!. It loads its whole field set into memory and 256Mi isn't enough:
dcgmExporter:
  resources:
    limits:
      memory: 1Gi
All of these fixes live in gpu-operator-values.yaml.
Who holds a card, and how to get it back
This is the part I'd most have wanted to read, because it's invisible until a GPU job won't schedule.
nvidia.com/gpu can't be oversubscribed. Without time-slicing, a pod with nvidia.com/gpu: 1 owns that physical card for its whole life. Three cards means three GPU pods at once, full stop.
That makes long-lived notebooks the quiet problem. At one point two Kubeflow notebooks were each holding a whole A1000, one of them for three and a half months, while asking for 0.6 and 1.2 CPUs. A notebook that asks for less than one CPU and holds an entire GPU is the shape of the problem. It also quietly capped a Katib sweep at one GPU trial at a time. And they cost more than cards: together they used over half of their namespace's CPU quota, enough to make a daily training pipeline time out because its last job could never be scheduled.
The claim is on the pod, not the Notebook, the StatefulSet or the volume. So stopping a notebook frees the card. Kubeflow's "stop" sets an annotation, the controller scales to zero, and the pod goes away:
kubectl -n <profile> annotate notebook <name> \
  kubeflow-resource-stopped="$(date -u +%Y-%m-%dT%H:%M:%SZ)" --overwrite
I sampled the free-GPU count every ten seconds while doing it:
[01] sts replicas=0   pod=Terminating   FREE GPUs=1
[02] sts replicas=0   pod=gone          FREE GPUs=2
Look at the first line. The notebook was "stopped" by every API you'd think to check, and the card was still claimed, because the pod hadn't finished terminating. replicas=0 isn't proof a card came back. On a cluster where KubeArmor can wedge pods in Terminating, that matters. The reliable check counts from the pods and cross-checks the scheduler:
# what pods claim
kubectl get pods -A -o json | jq '[.items[] | select(.status.phase=="Running" or .status.phase=="Pending")
  | .spec.containers[].resources.limits["nvidia.com/gpu"] // "0" | tonumber] | add'

# what the scheduler has allocated on a node
kubectl describe node <gpu-node> | awk '/Allocated resources/,/Events/' | grep nvidia.com/gpu
As I write this, both GPU notebooks are stopped and all three cards are free.
Culling is on as a safety net. The notebook controller stops notebooks that have been idle for 24 hours. It stops, it never deletes: the volume and every file survive, and restarting is one click. What's lost is in-memory kernel state. A running cell counts as busy, so a long training run won't be culled. And the setting is global and not GPU-aware, so it catches abandoned notebooks; it doesn't manage contention. The better lever is not giving notebooks a GPU by default.
⚠️ One more surprise: nvidia.com/gpu isn't in the profile namespaces' ResourceQuota, and a quota only limits what it names. So GPU use per namespace is unbounded even though CPU and memory are capped.
Putting the GPUs to work
Making nvidia.com/gpu schedulable was the prerequisite, not the goal.
Who on the platform can ask for a card
Nothing on this platform needs a GPU to run. Every Kubeflow component is a CPU service; what changes is the work users launch through them. Here's each door to a card, and whether anything has walked through it yet:
| Platform piece | How it asks for a card | Has it used one here? |
|---|---|---|
| Kubeflow Notebooks | a GPU dropdown in the spawner form | Yes, and too well: two notebooks held cards while idle |
| Katib | nvidia.com/gpu in the trial template |
No. Both sweeps ran on CPU |
| Kubeflow Trainer | resourcesPerNode on a TrainJob |
No. The runtimes are installed (torch-distributed, three torchtune LLM fine-tunes); no job has run |
| KServe | a GPU limit on the predictor | No. The one live model is XGBoost on CPU |
| Kubeflow Pipelines | a GPU limit on a single step | No. The daily pipeline is all CPU |
| Spark | executor GPU settings plus the RAPIDS plugin | No, and not planned: these jobs are small |
| A plain pod | one line, nvidia.com/gpu: 1 |
Yes: the LLM benchmark below |
Everything else in the data platform (Kafka, Airflow, MLflow, the databases) never touches a card and shouldn't.
So the honest summary is two real users so far: notebooks, which took cards and did nothing with them, and one benchmark pod, which took a card and drove it at 98%.
Hyperparameter search with Katib
Katib runs an Experiment that launches trials as pods, each reporting a metric back through an injected sidecar. Getting it to run at all taught me more than the GPUs did.
It couldn't run in any Kubeflow profile namespace. An Experiment sat at Created with zero trials, and the UI only said "Couldn't find any successful Trial." The real error was two levels down, on a ReplicaSet:
pods "<exp>-tpe-..." is forbidden:
  minimum memory usage per Container is 16Mi, but request is 10Mi
Katib asks for 10Mi of memory for its suggestion pods, and the Kyverno-generated LimitRange in every profile namespace has a 16Mi floor. Eleven of twelve algorithms had no explicit resources, so eleven of twelve couldn't schedule. Fixing those exposed the same problem on the trial pods, because the metrics sidecar is injected by a webhook and its default never shows up in the template. The fix is to raise Katib to meet the floor, not lower the floor:
runtime:
  suggestions:
    - algorithmName: tpe
      image: ghcr.io/kubeflow/katib/suggestion-hyperopt:v0.19.0
      resources:
        requests:
          cpu: 50m
          memory: 128Mi
        limits:
          cpu: 500m
          memory: 512Mi
  metricsCollectors:
    - kind: StdOut
      image: ghcr.io/kubeflow/katib/file-metrics-collector:v0.19.0
      resources:
        requests:
          cpu: 50m
          memory: 32Mi
        limits:
          cpu: 200m
          memory: 128Mi
Three more gotchas from getting a sweep to finish:
katib-configis mounted withsubPath, which never receives updates. Restart the Katib controller after every config change; waiting does nothing.Never put a multi-line
python3 -cscript in a trial template. The stdout collector rewrites the command into a shell string, and the inline script doesn't survive. Pass a file path and flags instead.A sub-second trial can finish before the collector attaches, which shows up as random failures with an empty observation. Pace the objective and set
backoffLimit: 1.
With all of that fixed, a 12-trial TPE sweep finished 12 out of 12 and found the known optimum, on CPU, because for a demonstration sweep a GPU changes nothing (more on that below). And with no time-slicing, the real ceiling for GPU trials is three at a time, one per card. A parallelTrialCount higher than that just leaves trials Pending.
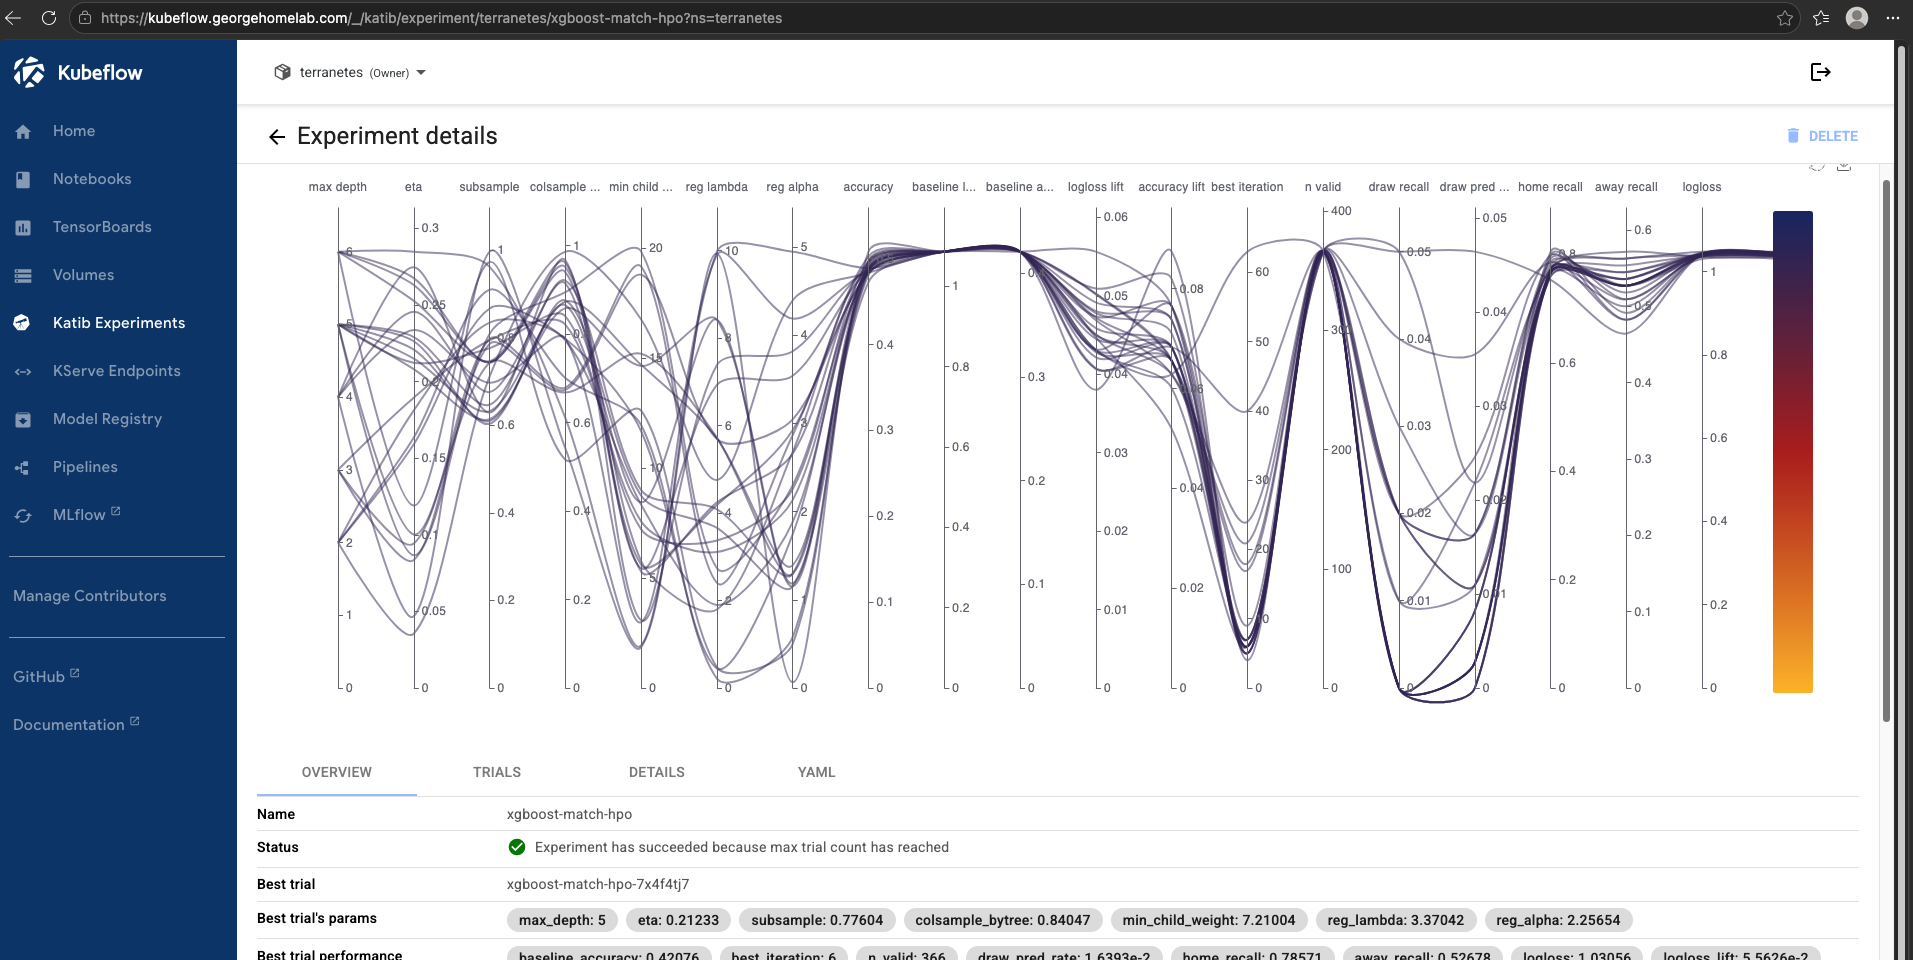
The Katib trial leaderboard with the best trial highlighted.
Training and serving
A GPU training job in Kubeflow Trainer V2 looks like this. I haven't run this one yet, so treat it as the shape, not a tested manifest. With one card per machine, two workers have to land on two different machines:
apiVersion: trainer.kubeflow.org/v1alpha1
kind: TrainJob
metadata:
  name: resnet-finetune
  namespace: terranetes
spec:
  runtimeRef:
    name: torch-distributed
  trainer:
    numNodes: 2
    resourcesPerNode:
      limits:
        nvidia.com/gpu: 1
For serving, a KServe InferenceService with minReplicas: 0 gives the card back when the model is idle and cold-starts it on demand. That works because the GPU claim is per pod: scale to zero, the pod goes, the card is free. With three cards, scale-to-zero is the difference between one always-on model and a fleet of models sharing three GPUs.
My live models today don't need a GPU at all. The football match predictor is an XGBoost model on tabular data, and it trains and serves on CPU in seconds. The first real GPU TrainJob and a properly served LLM are both on the list at the end.
The first real job: a 7B model on one card
For three months these cards passed their self-test and did nothing else. Prometheus has the receipts: 0% utilisation and 0 MiB of GPU memory on all three, the whole time. So before writing another word about what an A1000 can do, I made one do it.
The job is deliberately plain. One pod, one card, Ollama running Mistral 7B in 4-bit (Q4_K_M, a 4.1 GB download), the same prompt every time with a fixed seed. The whole request for hardware is one line, nvidia.com/gpu: 1. Kyverno added the toleration and the node rule, the scheduler put it on dc2, and nvidia-smi inside the container saw the card.
NAME          SIZE      PROCESSOR    CONTEXT
mistral:7b    5.8 GB    100% GPU     4096
Then the same model on the same node with the GPU switched off, four threads against the pod's four-core limit:
| Tokens per second | Notes | |
|---|---|---|
| RTX A1000 | about 30 (four runs: 29.9 to 31.6) | 5,031 MiB of the 8,188 MiB used, 98-99% utilisation |
| CPU, 4 threads (i9-13900H) | about 4.2 (two runs: 4.1 and 4.3) | same model, same prompt, same seed |
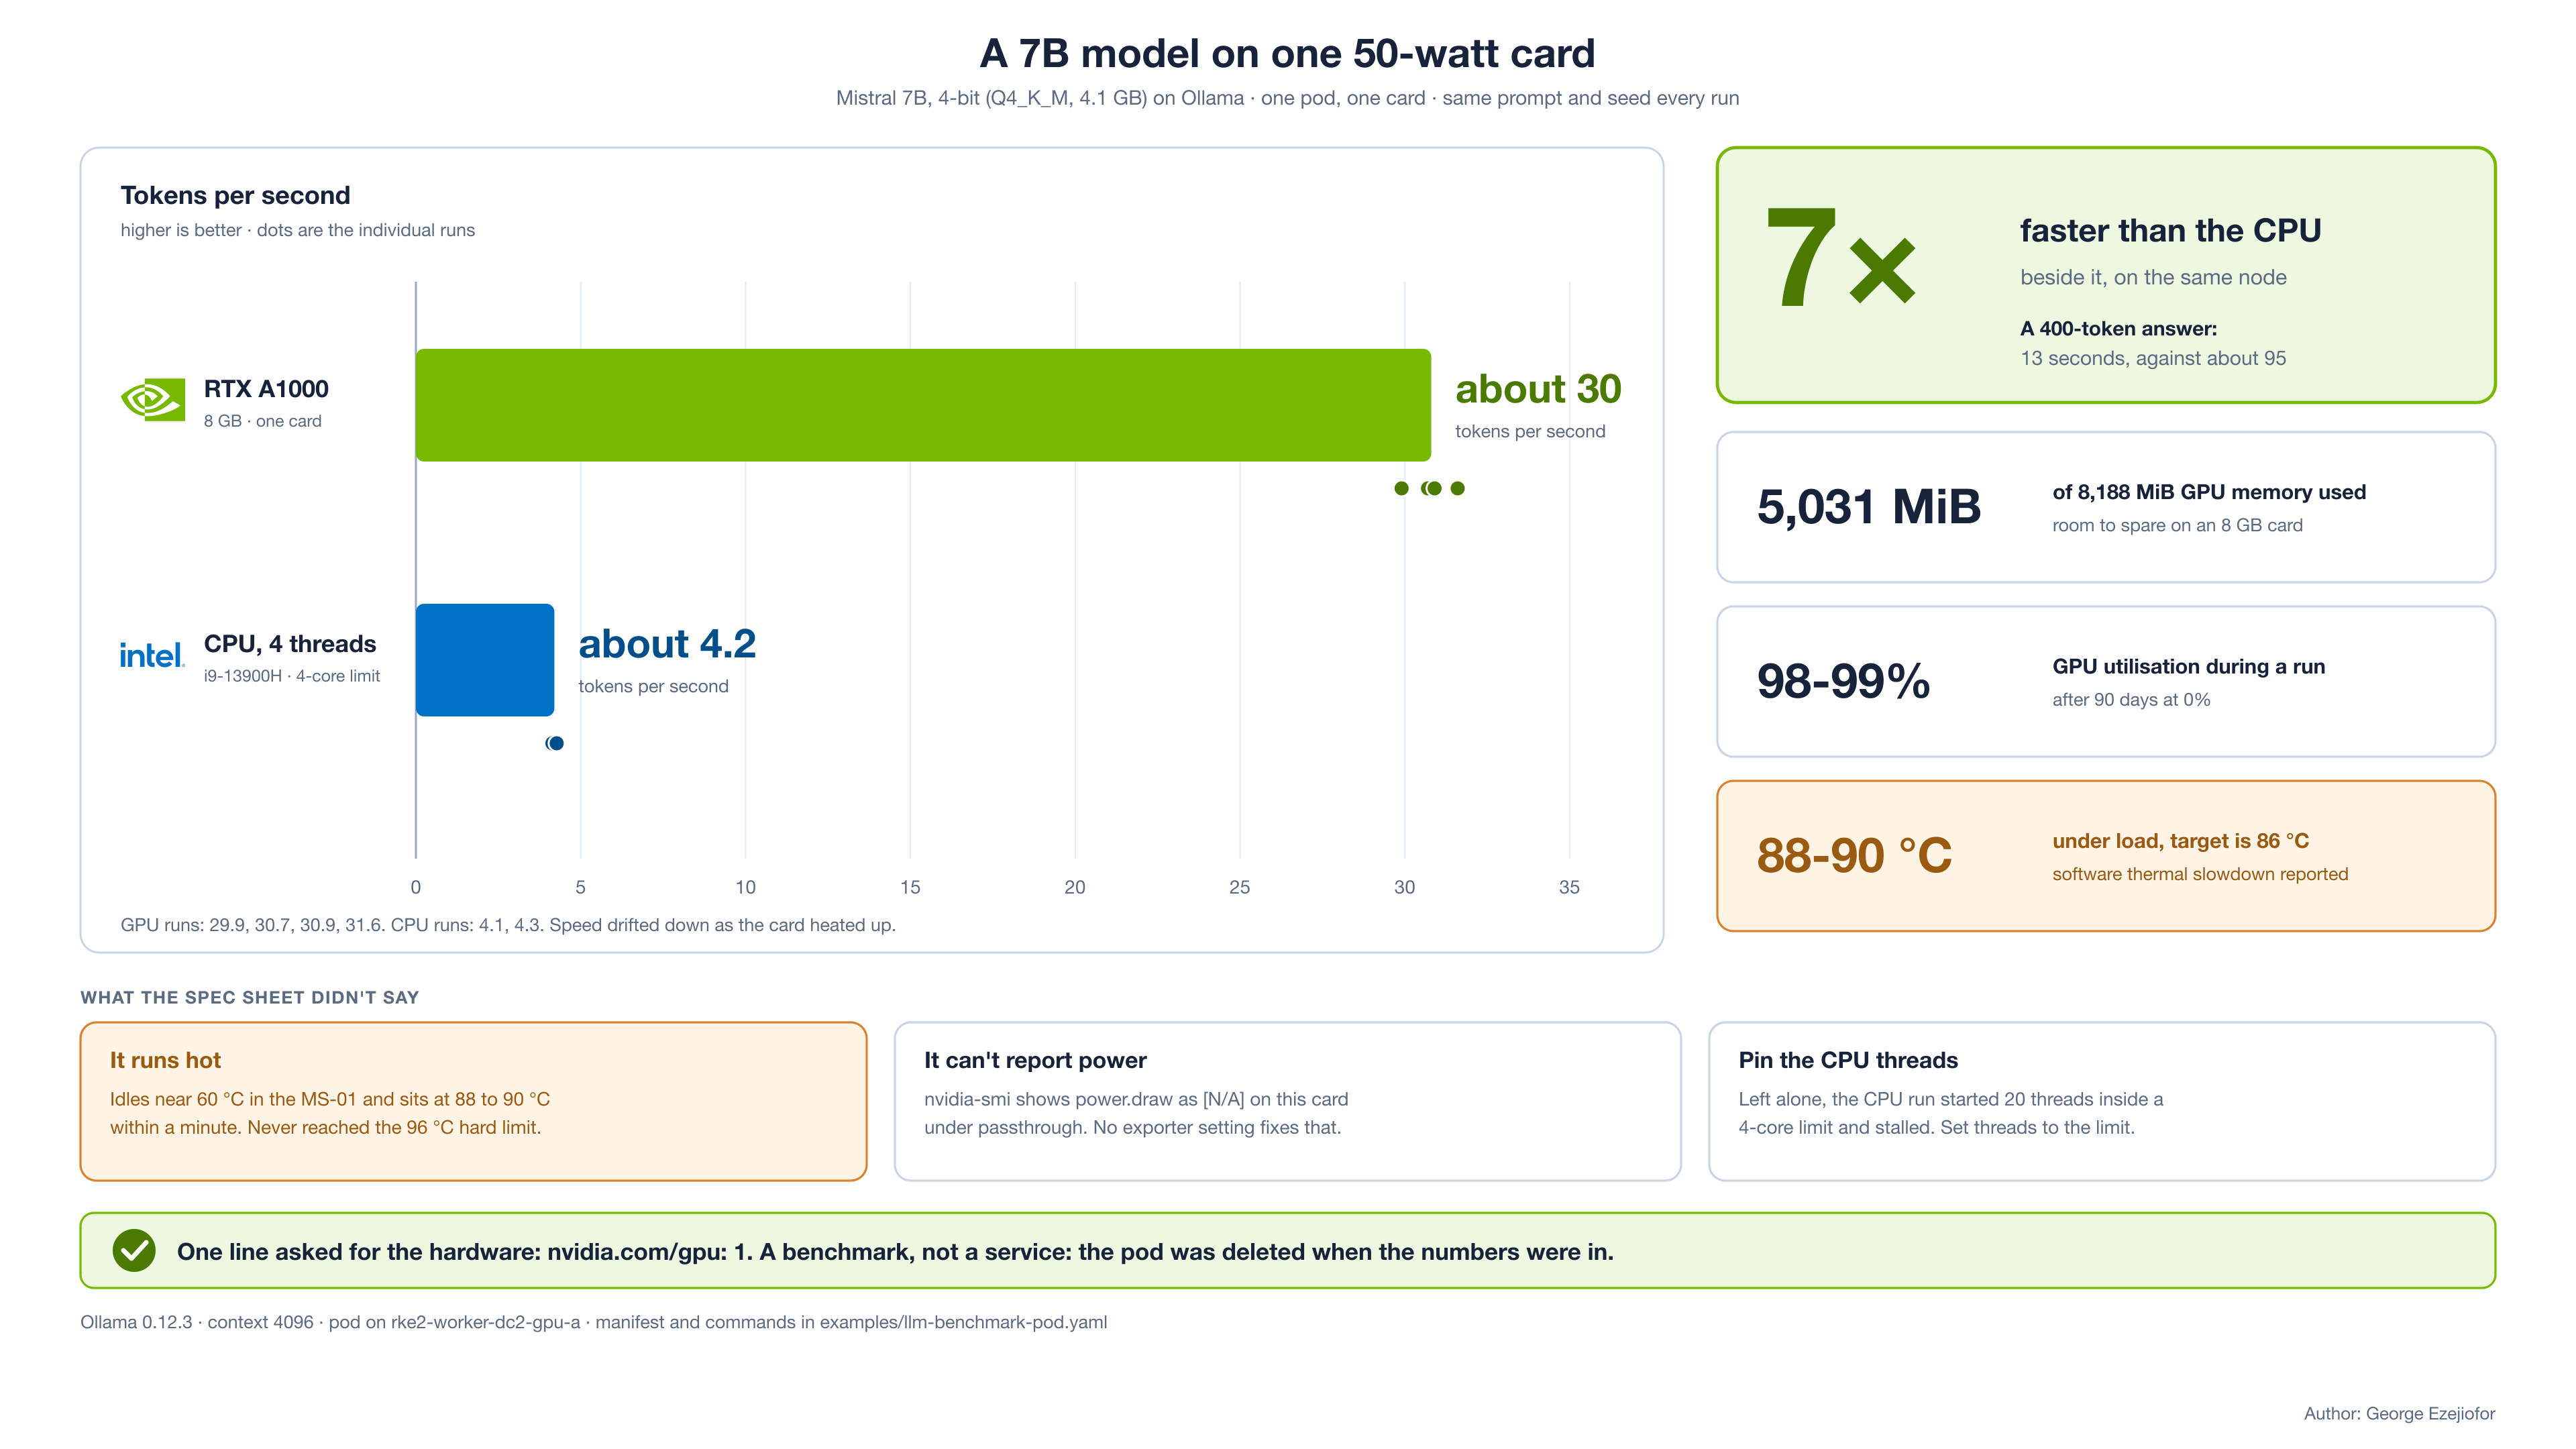
Mistral 7B on one RTX A1000 against the CPU beside it: about 30 tokens a second against about 4.2.
Seven times faster, on a 50-watt card that fits in a mini PC. A 400-token answer took 13 seconds on the GPU. At the CPU's rate it would take over a minute and a half. That is the difference between a tool you'd use and one you wouldn't.
Three things the run taught me that the spec sheet didn't:
It runs hot. The card idles at about 60 °C in the MS-01 and sat at 88 to 90 °C within a minute of load, a few degrees over its own 86 °C target, with the driver reporting a software thermal slowdown. Speed drifted from 31.6 to 29.9 tokens a second across the runs. It never reached the 96 °C hard slowdown, but a small case and a single-slot cooler have a ceiling, and sustained training will live at it.
It can't tell you its power draw.
nvidia-smireportspower.drawas[N/A]on this card under passthrough. So the missing power metric isn't an exporter setting I forgot.Threads matter more than cores. My first CPU run was left to pick its own thread count. It saw 20 cores, started 20 threads inside a four-core limit, and was still going ten minutes later. Pinned to four threads it produced 60 tokens in about fifteen seconds. If you benchmark CPU inside a container, set the thread count to the limit.
The manifest and the exact commands are in examples/llm-benchmark-pod.yaml. It's a benchmark, not a service: the pod holds a whole card while it exists, so I deleted it when the numbers were in, which is this article's own advice.
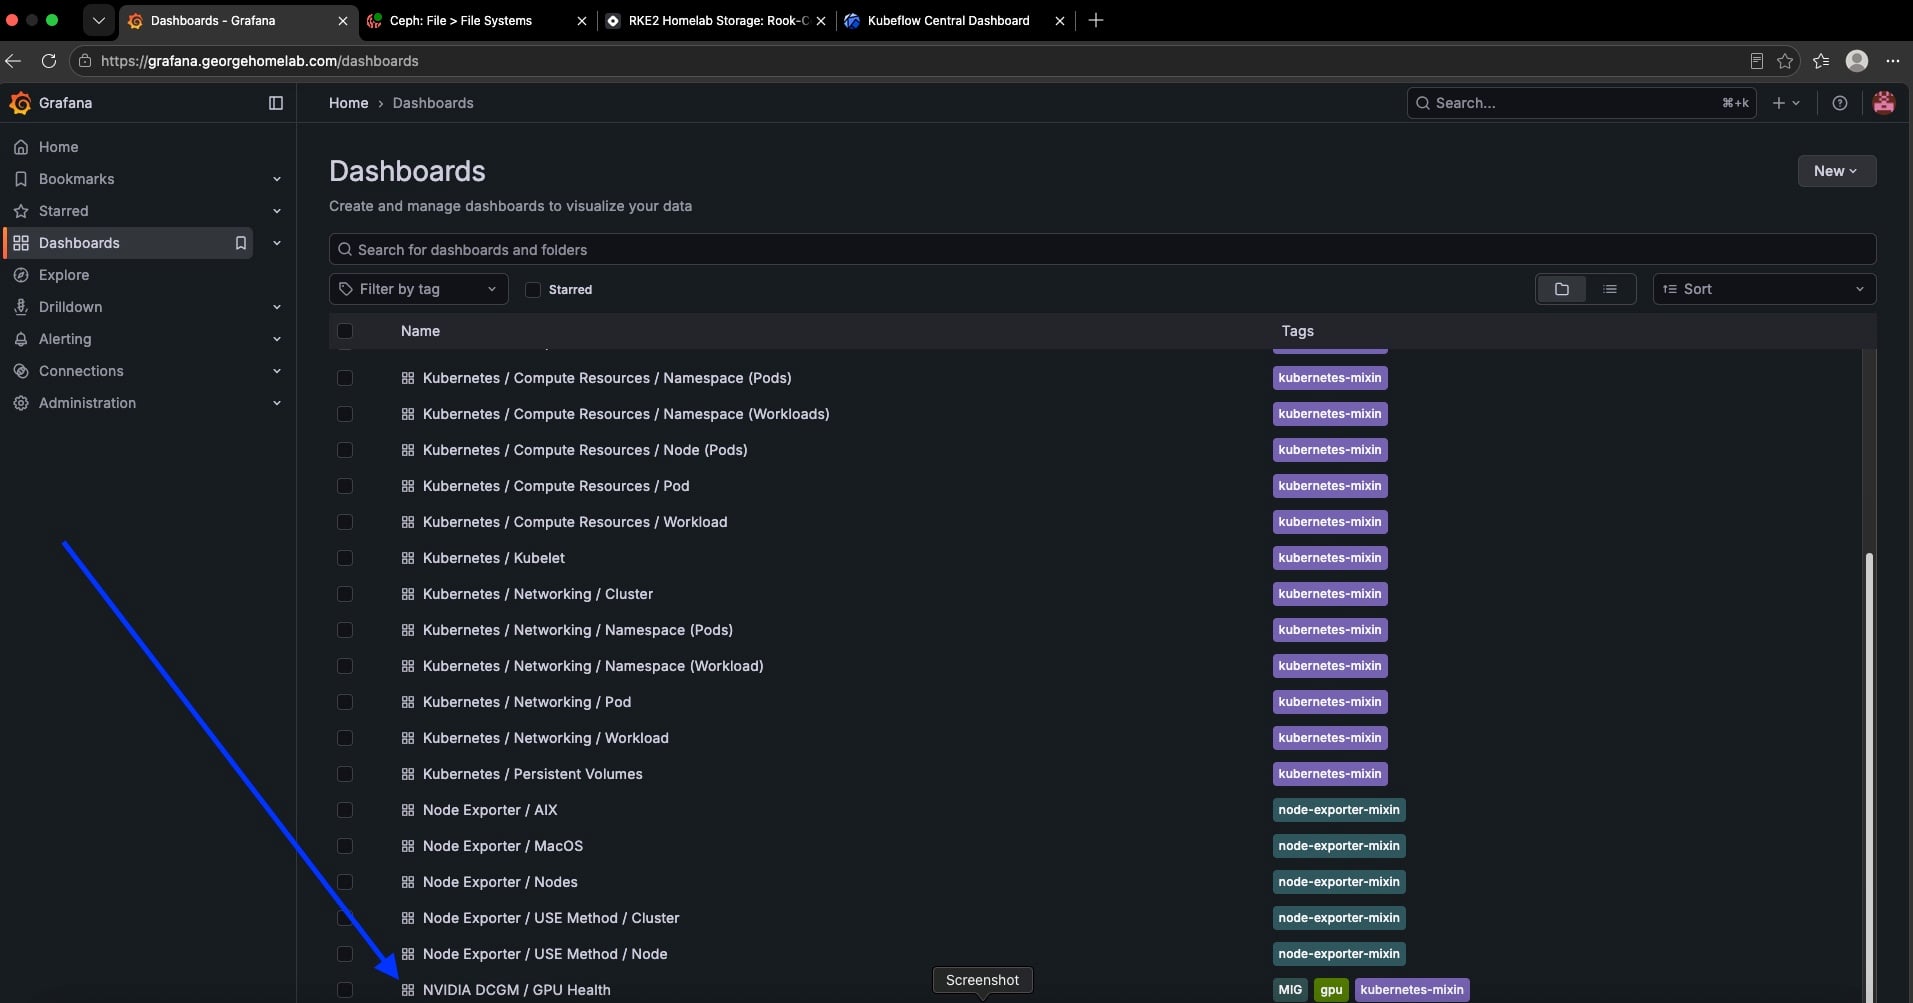
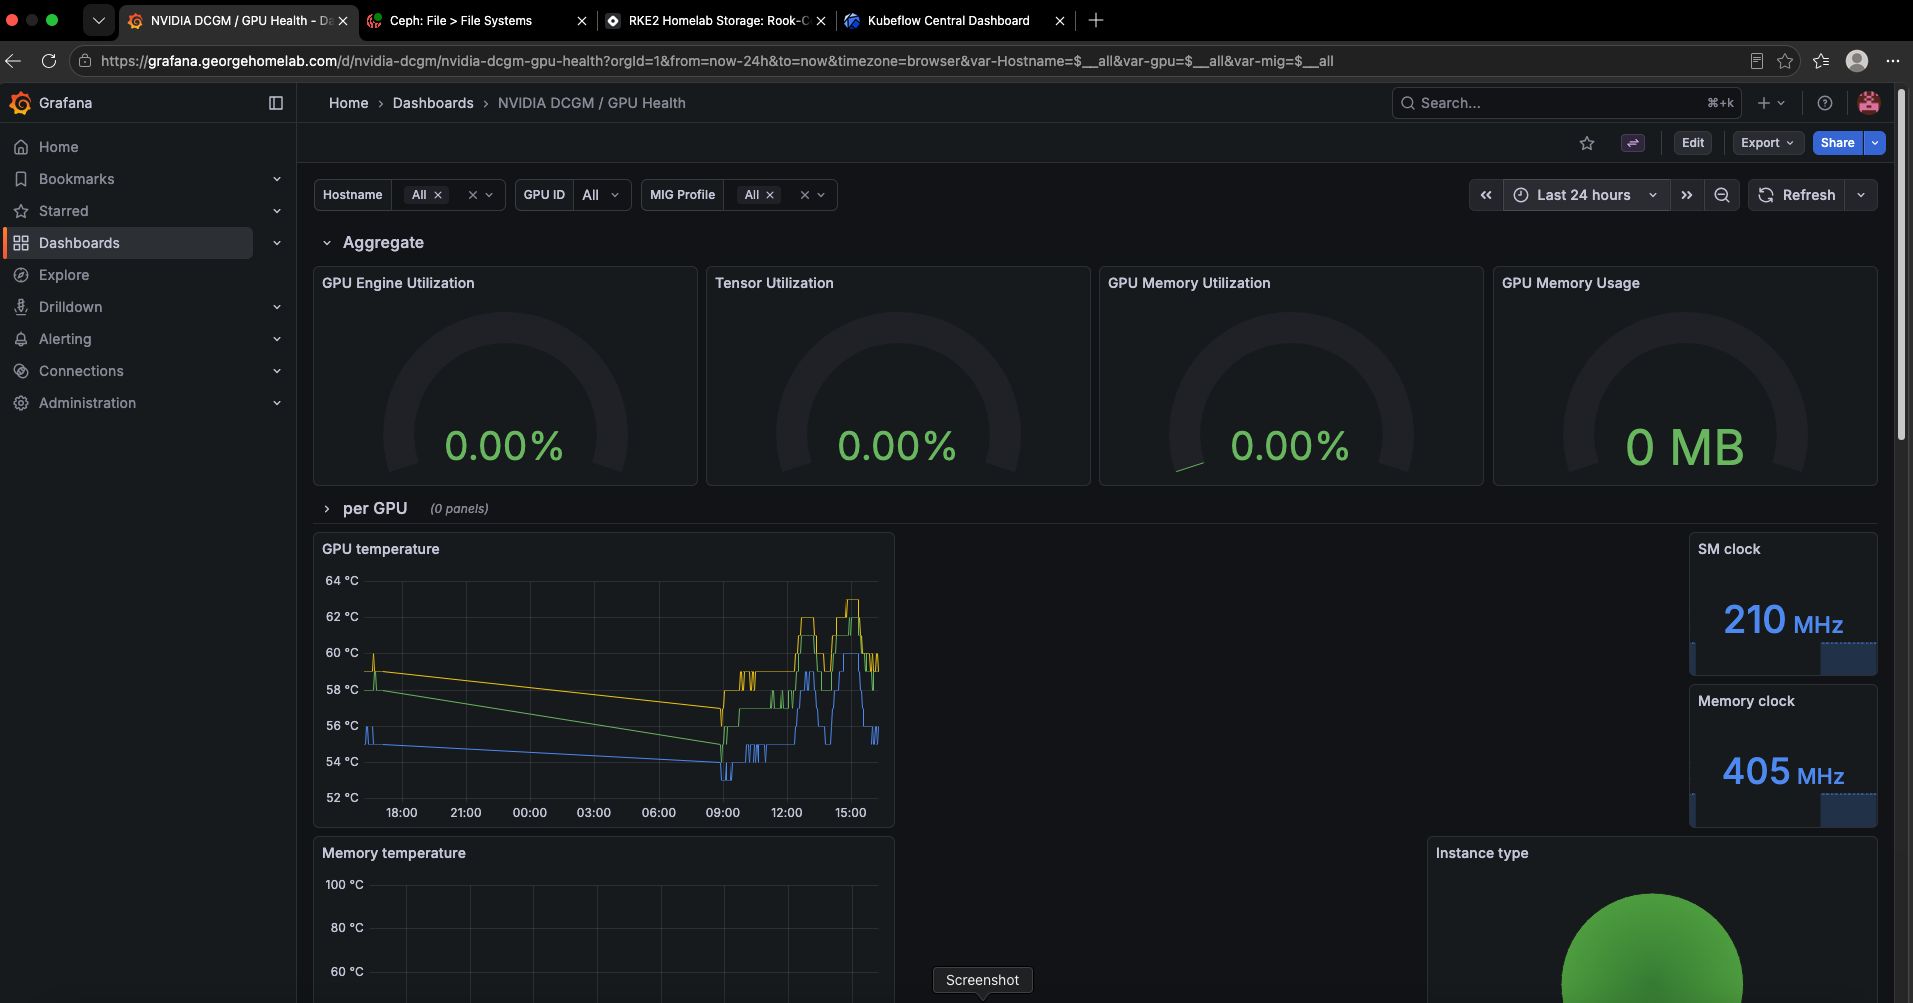
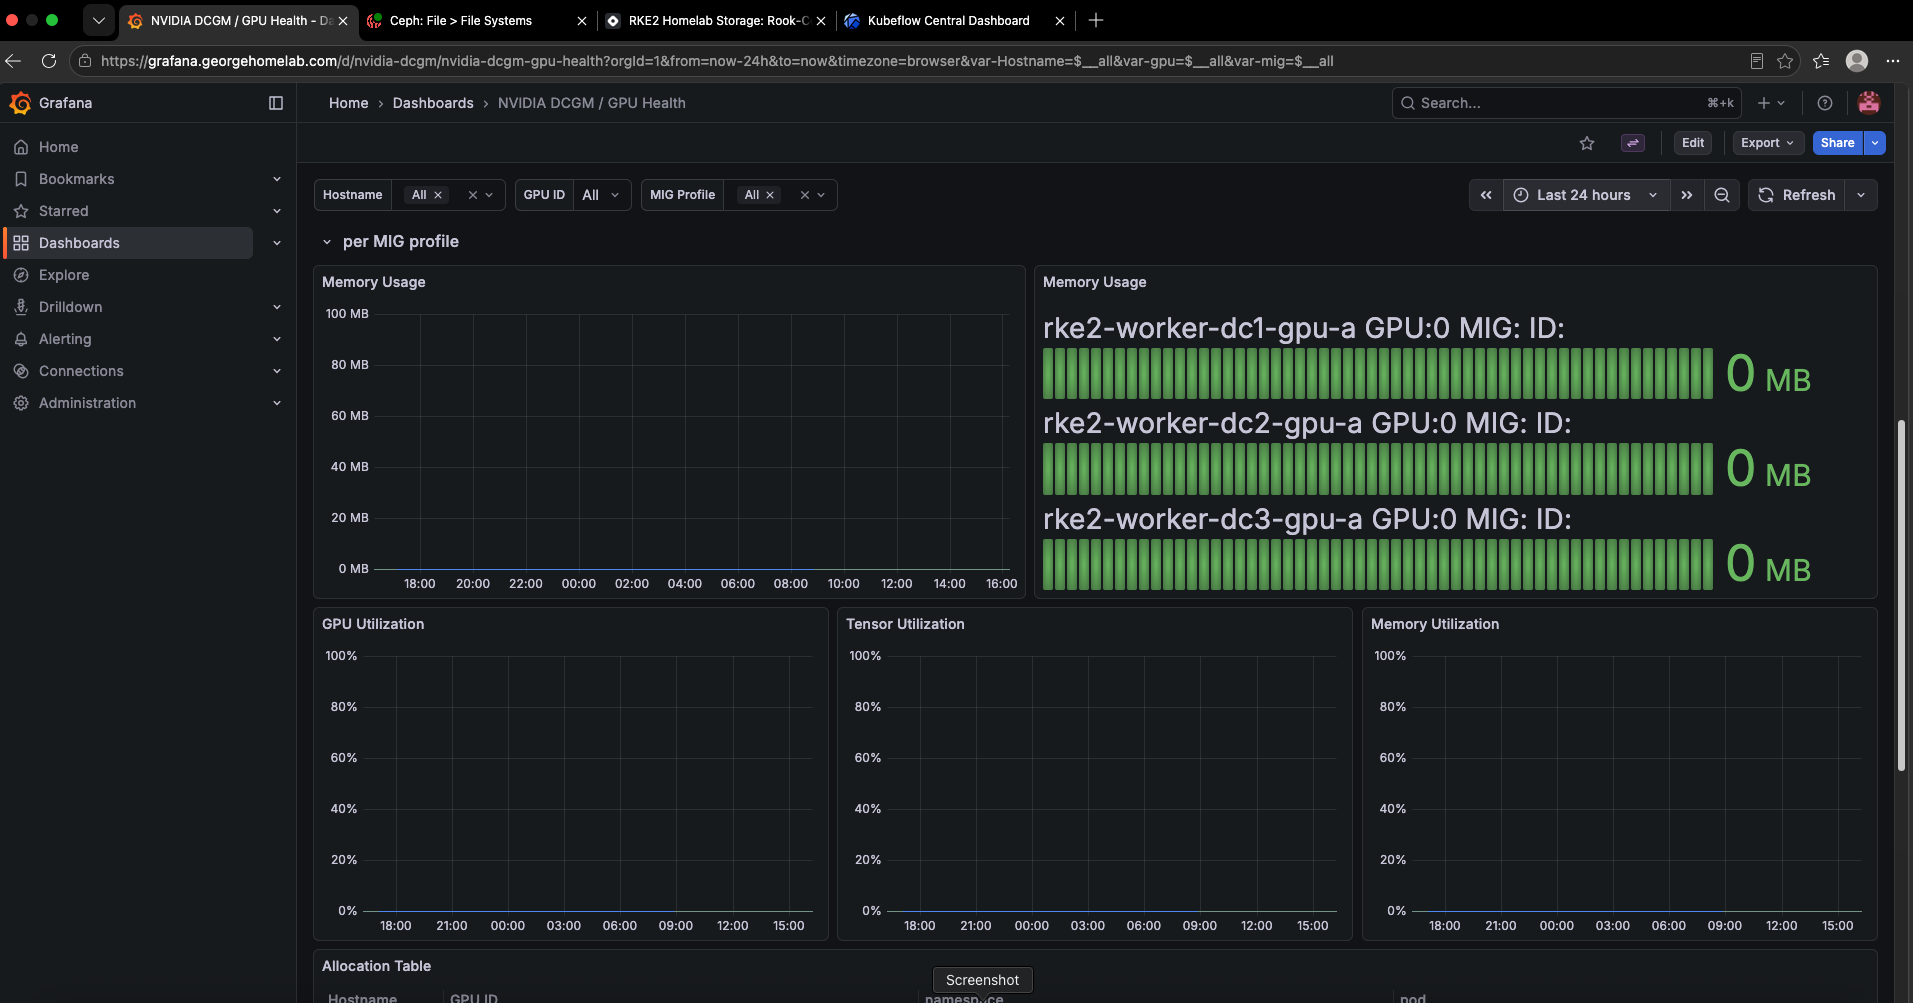
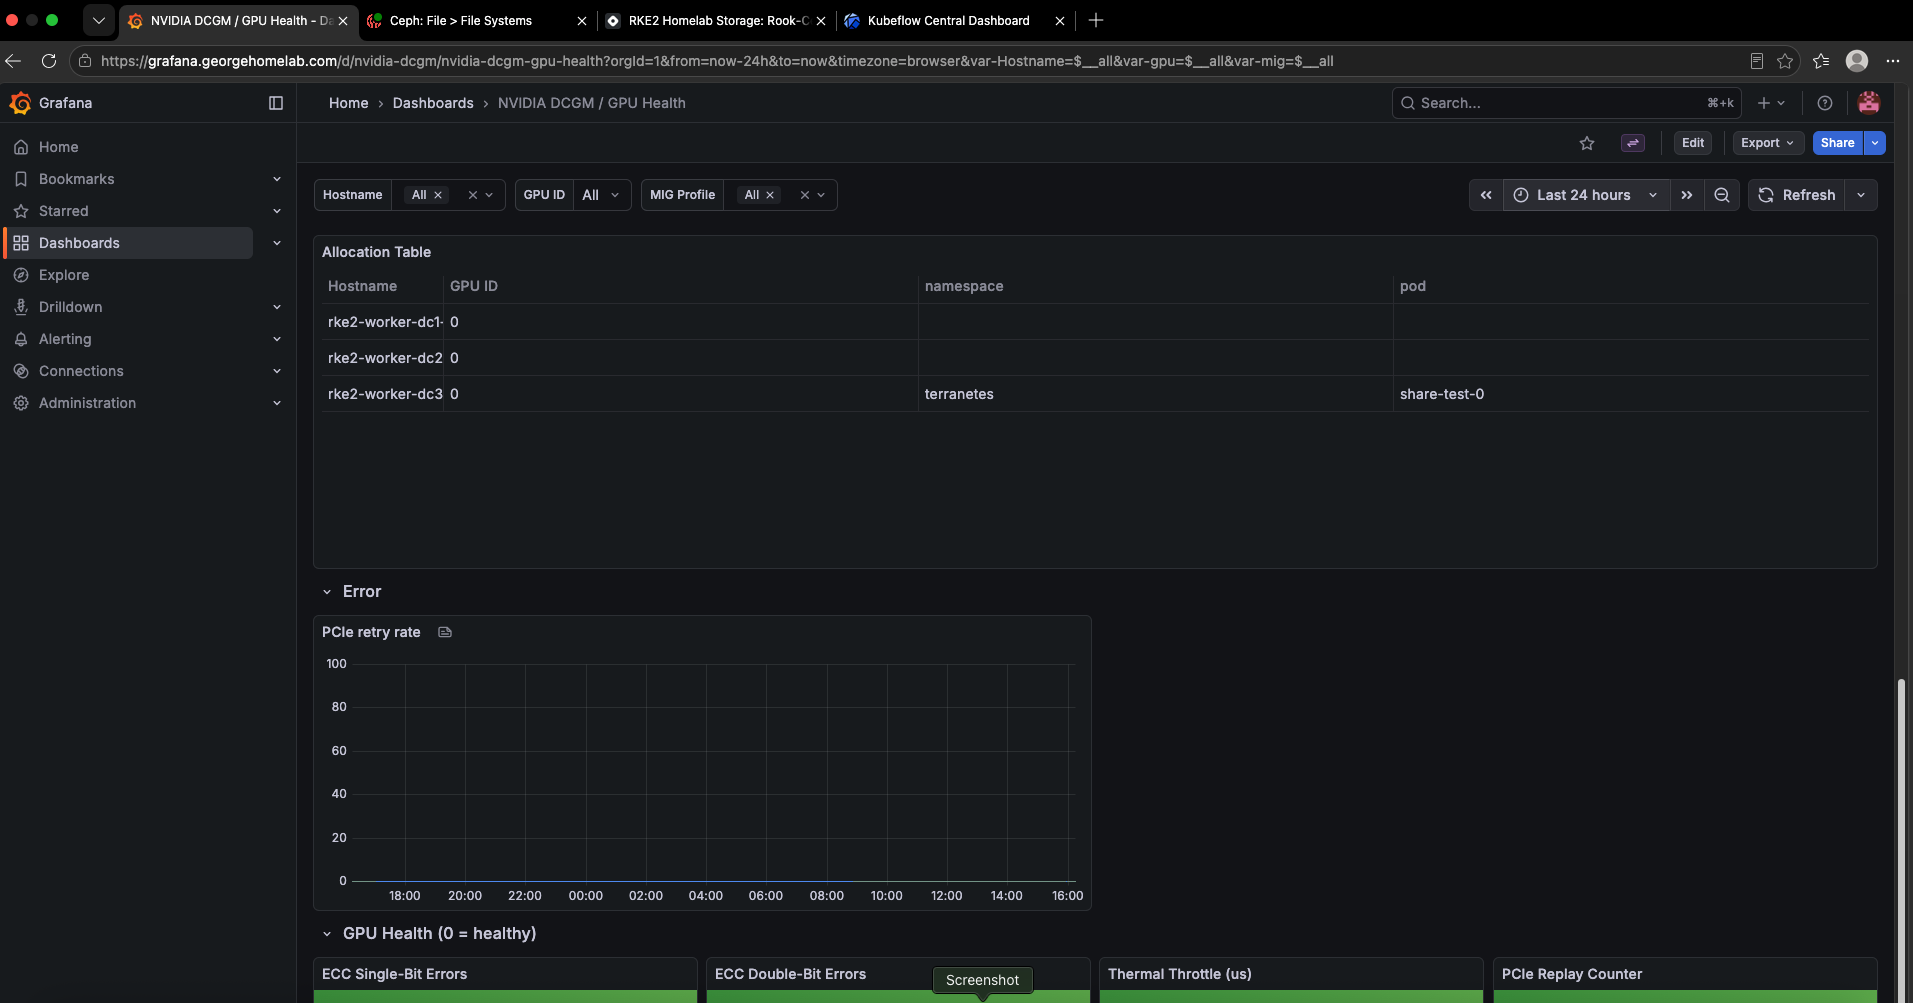
The Grafana DCGM dashboard for dc2 across the run: utilisation jumping from 0 to 98%, memory to 5 GiB, temperature from 60 to the high 80s. The first non-zero lines those panels have ever drawn.
Multi-GPU, and does a GPU change the result?
With more than one card, the internet will tell you to reach for tensor parallelism and model sharding. On three 8 GB cards over PCIe with no NVLink, most of that advice is wrong.
| Strategy | Splits | Use when | On these cards |
|---|---|---|---|
| Data parallel (DDP) | the batch, full model per GPU | the model fits in 8 GB | ✅ the default |
| Sharding (FSDP, ZeRO) | parameters and optimiser state | the model won't fit one GPU | ⚠️ prefer offloading to CPU RAM |
| Tensor parallel | individual layers | needs NVLink | ❌ slower over PCIe than not doing it |
| Pipeline parallel | layer stages | very deep models, many GPUs | ⚠️ rarely worth it here |
Use single-GPU tricks first (bf16, gradient checkpointing, smaller batches), then DDP for throughput, and only then sharding. For inference, don't shard: quantise. A 7B model in int4 fits on one card, and splitting it across two PCIe cards is strictly worse.
Does a GPU change the result, or just the speed? It changes how fast you get a result, not what the result is. With a fixed number of trials, a GPU gets you the same answer sooner. With a fixed amount of time, faster trials mean more trials, and more trials is how a search finds a better optimum. That gain comes from trial count, not from the GPU. And it can make results slightly worse: GPU reductions aren't always deterministic, so training often isn't bit-for-bit reproducible.
So putting a CPU-bound job on a GPU is theatre, and it costs a card something else needed.
Monitoring
The DCGM exporter publishes per-GPU metrics, and a ServiceMonitor puts them in Prometheus, with NVIDIA's dashboard in Grafana. The ones worth watching:
DCGM_FI_DEV_GPU_UTIL: utilisationDCGM_FI_DEV_FB_USEDandDCGM_FI_DEV_FB_FREE: memory used and freeDCGM_FI_DEV_GPU_TEMP: temperatureDCGM_FI_DEV_PCIE_REPLAY_COUNTER: link errors on the PCIe slot
Two I want and don't have. DCGM_FI_DEV_XID_ERRORS isn't in my exporter's field list yet. DCGM_FI_DEV_POWER_USAGE isn't either, and adding it won't help: this card doesn't report power draw under passthrough at all.
The most useful panel is utilisation by pod:
sum(DCGM_FI_DEV_GPU_UTIL{Hostname="rke2-worker-dc2-gpu-a"}) by (exported_namespace, exported_pod)
Mind the label. On my setup pod is the exporter's own pod, and the workload is in exported_pod. Group by pod and every card looks like it's being used by the DCGM exporter.
What's missing is any alerting. The metrics are there, but nothing fires on a hot card, full memory or an XID error yet. And the metric I want most isn't on any dashboard: allocated versus used. A card that's 100% allocated and 0% used is the notebook problem, and utilisation alone makes it look exactly like a free card.
NVIDIA has since open-sourced something aimed at exactly that gap: the GPU Usage Monitor, an Apache 2.0 Helm chart that pairs the DCGM exporter with kube-state-metrics, Prometheus and Grafana, and ships dashboards for allocated against used, by namespace and by pod, plus GPU pods stuck Pending. I haven't installed it. I already run every one of those four pieces, so what I'd want from it is the dashboards, not a second Prometheus. And its platform filter is named for datacenter cards (Hopper, Blackwell), so I don't yet know how it treats an A1000. It's on the list.
What it costs
Three used RTX A1000s for about £600, in slots the MS-01s already had. No extra power. The card is rated at 50 W; I can't give you a measured figure, because it doesn't report one. Cooling is the honest cost: nothing extra was fitted, and under load the card sits at its thermal limit.
The operational cost is mostly kernel upgrades on GPU nodes, which need the driver restart. Adding a GPU node is now Terraform the passthrough, label and taint it, and let the operator do the rest.
What's Next?
The sports car runs, survives a power cut and comes back on its own. What's left, roughly in order:
Try NVIDIA's GPU Usage Monitor dashboards against the Prometheus I already have, to get allocated versus used on a screen.
Export XID errors, then wire up GPU alerts: temperature (now that I know it reaches 90 °C), memory nearly full, XID errors, and a card allocated but unused for hours.
Turn on time-slicing on dc1 and dc2, and keep dc3 whole.
Put
nvidia.com/gpuin the profile ResourceQuota, so one namespace can't take every card.Run a real GPU TrainJob across two machines, and serve that LLM properly behind KServe with scale-to-zero, not from a benchmark pod.
Automate the driver restart after a GPU node's kernel upgrade, so it stops being a checklist item.
If you've got a GPU sitting in a box that Kubernetes can't see, I hope this saves you the thirteen traps on this list.
Author: George Ezejiofor